
|
ABC-Mart, inc. (2670.T) Avaliação DCF |
Totalmente Editável: Adapte-Se Às Suas Necessidades No Excel Ou Planilhas
Design Profissional: Modelos Confiáveis E Padrão Da Indústria
Pré-Construídos Para Uso Rápido E Eficiente
Compatível com MAC/PC, totalmente desbloqueado
Não É Necessária Experiência; Fácil De Seguir
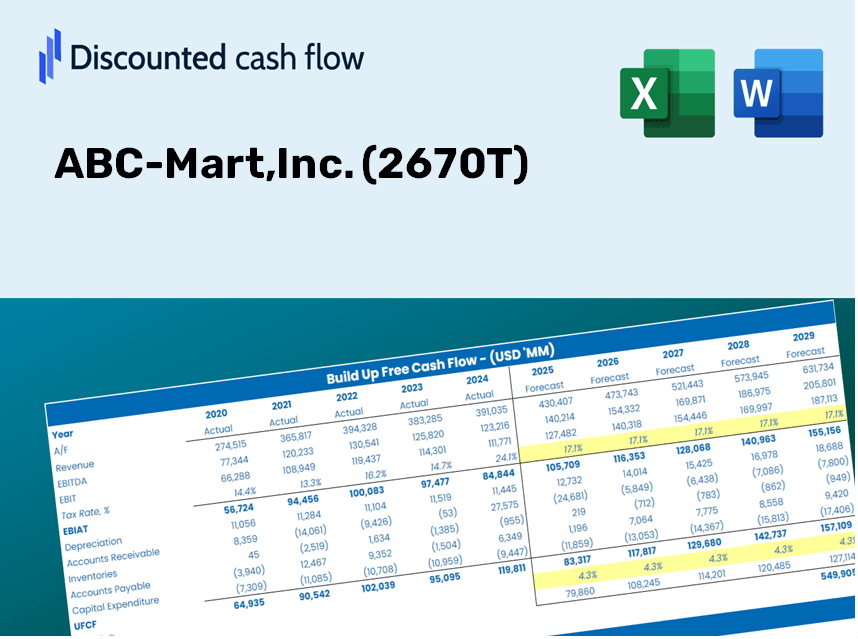
ABC-Mart,Inc. (2670.T) Bundle
Projetado para precisão, nossa calculadora DCF (2670T) permite avaliar a avaliação da ABC-Mart, Inc. usando dados financeiros do mundo real e fornece flexibilidade completa para modificar todos os parâmetros essenciais para projeções aprimoradas.
Discounted Cash Flow (DCF) - (USD MM)
| Year | AY1 2021 |
AY2 2022 |
AY3 2023 |
AY4 2024 |
AY5 2025 |
FY1 2026 |
FY2 2027 |
FY3 2028 |
FY4 2029 |
FY5 2030 |
|---|---|---|---|---|---|---|---|---|---|---|
| Revenue | 220,267.0 | 243,946.0 | 290,077.0 | 344,197.0 | 372,202.0 | 424,732.6 | 484,677.2 | 553,082.0 | 631,141.1 | 720,217.1 |
| Revenue Growth, % | 0 | 10.75 | 18.91 | 18.66 | 8.14 | 14.11 | 14.11 | 14.11 | 14.11 | 14.11 |
| EBITDA | 35,292.0 | 32,318.0 | 48,774.0 | 63,180.0 | 70,461.0 | 70,820.9 | 80,816.2 | 92,222.2 | 105,237.9 | 120,090.7 |
| EBITDA, % | 16.02 | 13.25 | 16.81 | 18.36 | 18.93 | 16.67 | 16.67 | 16.67 | 16.67 | 16.67 |
| Depreciation | 6,170.0 | 6,457.0 | 6,300.0 | 5,914.0 | 5,862.0 | 9,270.2 | 10,578.6 | 12,071.6 | 13,775.3 | 15,719.5 |
| Depreciation, % | 2.8 | 2.65 | 2.17 | 1.72 | 1.57 | 2.18 | 2.18 | 2.18 | 2.18 | 2.18 |
| EBIT | 29,122.0 | 25,861.0 | 42,474.0 | 57,266.0 | 64,599.0 | 61,550.7 | 70,237.6 | 80,150.6 | 91,462.6 | 104,371.2 |
| EBIT, % | 13.22 | 10.6 | 14.64 | 16.64 | 17.36 | 14.49 | 14.49 | 14.49 | 14.49 | 14.49 |
| Total Cash | 146,626.0 | 151,948.0 | 148,447.0 | 176,358.0 | 205,169.0 | 243,278.8 | 277,613.9 | 316,794.9 | 361,505.7 | 412,526.7 |
| Total Cash, percent | .0 | .0 | .0 | .0 | .0 | .0 | .0 | .0 | .0 | .0 |
| Account Receivables | 10,241.0 | 10,946.0 | 14,926.0 | 16,022.0 | 15,622.0 | 19,651.5 | 22,425.1 | 25,590.0 | 29,201.7 | 33,323.0 |
| Account Receivables, % | 4.65 | 4.49 | 5.15 | 4.65 | 4.2 | 4.63 | 4.63 | 4.63 | 4.63 | 4.63 |
| Inventories | 63,356.0 | 59,847.0 | 88,584.0 | 88,942.0 | 91,543.0 | 114,057.4 | 130,154.9 | 148,524.3 | 169,486.2 | 193,406.6 |
| Inventories, % | 28.76 | 24.53 | 30.54 | 25.84 | 24.59 | 26.85 | 26.85 | 26.85 | 26.85 | 26.85 |
| Accounts Payable | 14,468.0 | 13,161.0 | 12,484.0 | 15,238.0 | 20,518.0 | 22,261.8 | 25,403.7 | 28,989.1 | 33,080.4 | 37,749.2 |
| Accounts Payable, % | 6.57 | 5.4 | 4.3 | 4.43 | 5.51 | 5.24 | 5.24 | 5.24 | 5.24 | 5.24 |
| Capital Expenditure | -6,604.0 | -9,978.0 | -6,869.0 | -7,583.0 | -10,053.0 | -12,198.7 | -13,920.4 | -15,885.0 | -18,127.0 | -20,685.3 |
| Capital Expenditure, % | -3 | -4.09 | -2.37 | -2.2 | -2.7 | -2.87 | -2.87 | -2.87 | -2.87 | -2.87 |
| Tax Rate, % | 29.75 | 29.75 | 29.75 | 29.75 | 29.75 | 29.75 | 29.75 | 29.75 | 29.75 | 29.75 |
| EBITAT | 19,230.6 | 17,396.1 | 30,123.4 | 40,015.3 | 45,379.4 | 42,389.7 | 48,372.4 | 55,199.4 | 62,990.0 | 71,880.1 |
| Depreciation | ||||||||||
| Changes in Account Receivables | ||||||||||
| Changes in Inventories | ||||||||||
| Changes in Accounts Payable | ||||||||||
| Capital Expenditure | ||||||||||
| UFCF | -40,332.4 | 15,372.1 | -3,839.6 | 39,646.3 | 44,267.4 | 14,661.1 | 29,301.5 | 33,437.0 | 38,156.1 | 43,541.3 |
| WACC, % | 4.68 | 4.68 | 4.68 | 4.68 | 4.68 | 4.68 | 4.68 | 4.68 | 4.68 | 4.68 |
| PV UFCF | ||||||||||
| SUM PV UFCF | 136,324.0 | |||||||||
| Long Term Growth Rate, % | 3.00 | |||||||||
| Free cash flow (T + 1) | 44,848 | |||||||||
| Terminal Value | 2,673,627 | |||||||||
| Present Terminal Value | 2,127,336 | |||||||||
| Enterprise Value | 2,263,660 | |||||||||
| Net Debt | -193,701 | |||||||||
| Equity Value | 2,457,361 | |||||||||
| Diluted Shares Outstanding, MM | 248 | |||||||||
| Equity Value Per Share | 9,924.04 |
What You Will Receive
- Genuine ABC-Mart Financial Data: Access to both historical and projected figures for precise valuation.
- Customizable Inputs: Adjust parameters like WACC, tax rates, revenue growth, and capital investments.
- Automated Calculations: Intrinsic value and NPV are computed in real-time.
- Scenario Testing: Explore various scenarios to assess ABC-Mart's future performance.
- User-Friendly Design: Engineered for professionals but easy for newcomers to navigate.
Core Features
- Comprehensive DCF Calculator: Features detailed unlevered and levered DCF valuation models for precise assessments.
- WACC Calculator: Pre-configured Weighted Average Cost of Capital sheet with adjustable inputs tailored to your needs.
- Customizable Forecast Assumptions: Easily adjust growth rates, capital expenditures, and discount rates to fit your analysis.
- Integrated Financial Ratios: Evaluate profitability, leverage, and efficiency ratios specifically for ABC-Mart, Inc. (2670T).
- Interactive Dashboard and Charts: Visual displays condense essential valuation metrics for straightforward analysis.
How It Functions
- Download: Obtain the pre-packaged Excel file featuring ABC-Mart, Inc.'s (2670T) financial data.
- Customize: Modify projections, including sales growth, EBITDA %, and WACC.
- Update Automatically: Enjoy real-time updates for intrinsic value and NPV calculations.
- Test Scenarios: Generate various projections and instantly compare the results.
- Make Decisions: Utilize the valuation insights to inform your investment strategies.
Why Opt for ABC-Mart, Inc. ([2670T]) Calculator?
- All-in-One Solution: Features DCF, WACC, and financial ratio evaluations all in a single tool.
- Flexible Inputs: Modify the yellow-highlighted fields to explore different scenarios.
- In-Depth Analysis: Automatically computes the intrinsic value and Net Present Value for ABC-Mart, Inc. ([2670T]).
- Ready-to-Use Data: Includes historical and projected data for reliable initial calculations.
- High-Quality Standard: Perfect for financial analysts, investors, and business consultants.
Who Can Benefit from This Product?
- Investors: Evaluate ABC-Mart, Inc. (2670T)'s valuation to make informed buying or selling decisions.
- CFOs and Financial Analysts: Enhance valuation workflows and assess financial projections.
- Startup Founders: Discover how leading companies like ABC-Mart, Inc. (2670T) determine their market value.
- Consultants: Prepare comprehensive valuation reports for clients in various sectors.
- Students and Educators: Utilize real-life financial data to practice and impart valuation methods.
Overview of the Template Features
- In-Depth DCF Model: A customizable template featuring thorough valuation calculations.
- Current Market Data: ABC-Mart, Inc.'s (2670T) historical and projected financial information preloaded for your analysis.
- Adjustable Variables: Modify WACC, growth rates, and tax assumptions to explore different scenarios.
- Comprehensive Financial Statements: Detailed annual and quarterly breakdowns for enhanced understanding.
- Essential Ratios: Integrated analysis for assessing profitability, efficiency, and leverage.
- Visual Dashboard: Engaging charts and tables that present clear and actionable insights.
Disclaimer
All information, articles, and product details provided on this website are for general informational and educational purposes only. We do not claim any ownership over, nor do we intend to infringe upon, any trademarks, copyrights, logos, brand names, or other intellectual property mentioned or depicted on this site. Such intellectual property remains the property of its respective owners, and any references here are made solely for identification or informational purposes, without implying any affiliation, endorsement, or partnership.
We make no representations or warranties, express or implied, regarding the accuracy, completeness, or suitability of any content or products presented. Nothing on this website should be construed as legal, tax, investment, financial, medical, or other professional advice. In addition, no part of this site—including articles or product references—constitutes a solicitation, recommendation, endorsement, advertisement, or offer to buy or sell any securities, franchises, or other financial instruments, particularly in jurisdictions where such activity would be unlawful.
All content is of a general nature and may not address the specific circumstances of any individual or entity. It is not a substitute for professional advice or services. Any actions you take based on the information provided here are strictly at your own risk. You accept full responsibility for any decisions or outcomes arising from your use of this website and agree to release us from any liability in connection with your use of, or reliance upon, the content or products found herein.