
|
Adastria Co., Ltd. (2685.T) Avaliação DCF |
Totalmente Editável: Adapte-Se Às Suas Necessidades No Excel Ou Planilhas
Design Profissional: Modelos Confiáveis E Padrão Da Indústria
Pré-Construídos Para Uso Rápido E Eficiente
Compatível com MAC/PC, totalmente desbloqueado
Não É Necessária Experiência; Fácil De Seguir
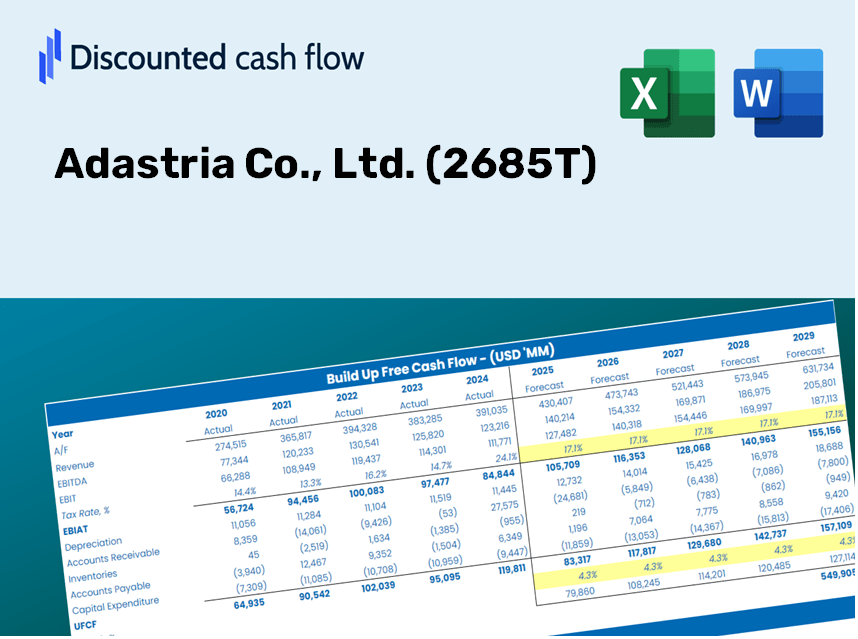
Adastria Co., Ltd. (2685.T) Bundle
Seja você um investidor ou analista, esta calculadora DCF (2685T) é o seu recurso preferido para uma avaliação precisa. Com dados reais da Adastria Co., Ltd. pré -carregados, você pode ajustar as previsões e observar instantaneamente seu impacto.
Discounted Cash Flow (DCF) - (USD MM)
| Year | AY1 2020 |
AY2 2021 |
AY3 2022 |
AY4 2023 |
AY5 2024 |
FY1 2025 |
FY2 2026 |
FY3 2027 |
FY4 2028 |
FY5 2029 |
|---|---|---|---|---|---|---|---|---|---|---|
| Revenue | 183,870.0 | 201,582.0 | 242,552.0 | 275,596.0 | 293,110.0 | 329,701.5 | 370,861.1 | 417,159.0 | 469,236.6 | 527,815.6 |
| Revenue Growth, % | 0 | 9.63 | 20.32 | 13.62 | 6.35 | 12.48 | 12.48 | 12.48 | 12.48 | 12.48 |
| EBITDA | 8,081.0 | 15,161.0 | 20,685.0 | 27,659.0 | 26,394.0 | 26,036.5 | 29,286.8 | 32,943.0 | 37,055.5 | 41,681.5 |
| EBITDA, % | 4.39 | 7.52 | 8.53 | 10.04 | 9 | 7.9 | 7.9 | 7.9 | 7.9 | 7.9 |
| Depreciation | 7,313.0 | 7,102.0 | 9,059.0 | 10,296.0 | 11,488.0 | 12,456.5 | 14,011.5 | 15,760.7 | 17,728.2 | 19,941.4 |
| Depreciation, % | 3.98 | 3.52 | 3.73 | 3.74 | 3.92 | 3.78 | 3.78 | 3.78 | 3.78 | 3.78 |
| EBIT | 768.0 | 8,059.0 | 11,626.0 | 17,363.0 | 14,906.0 | 13,580.0 | 15,275.3 | 17,182.3 | 19,327.3 | 21,740.1 |
| EBIT, % | 0.41769 | 4 | 4.79 | 6.3 | 5.09 | 4.12 | 4.12 | 4.12 | 4.12 | 4.12 |
| Total Cash | 24,179.0 | 16,976.0 | 16,380.0 | 23,371.0 | 21,143.0 | 29,025.7 | 32,649.2 | 36,725.1 | 41,309.8 | 46,466.9 |
| Total Cash, percent | .0 | .0 | .0 | .0 | .0 | .0 | .0 | .0 | .0 | .0 |
| Account Receivables | 9,677.0 | 9,807.0 | 12,090.0 | 15,732.0 | 14,475.0 | 16,985.7 | 19,106.2 | 21,491.4 | 24,174.4 | 27,192.3 |
| Account Receivables, % | 5.26 | 4.87 | 4.98 | 5.71 | 4.94 | 5.15 | 5.15 | 5.15 | 5.15 | 5.15 |
| Inventories | 15,718.0 | 19,259.0 | 24,679.0 | 26,839.0 | 29,082.0 | 31,610.1 | 35,556.3 | 39,995.1 | 44,988.1 | 50,604.3 |
| Inventories, % | 8.55 | 9.55 | 10.17 | 9.74 | 9.92 | 9.59 | 9.59 | 9.59 | 9.59 | 9.59 |
| Accounts Payable | 9,548.0 | 11,282.0 | 13,280.0 | 14,013.0 | 22,311.0 | 19,097.0 | 21,481.1 | 24,162.7 | 27,179.2 | 30,572.2 |
| Accounts Payable, % | 5.19 | 5.6 | 5.48 | 5.08 | 7.61 | 5.79 | 5.79 | 5.79 | 5.79 | 5.79 |
| Capital Expenditure | -6,502.0 | -6,932.0 | -10,508.0 | -8,988.0 | -7,521.0 | -11,298.5 | -12,709.0 | -14,295.6 | -16,080.3 | -18,087.7 |
| Capital Expenditure, % | -3.54 | -3.44 | -4.33 | -3.26 | -2.57 | -3.43 | -3.43 | -3.43 | -3.43 | -3.43 |
| Tax Rate, % | 34.4 | 34.4 | 34.4 | 34.4 | 34.4 | 34.4 | 34.4 | 34.4 | 34.4 | 34.4 |
| EBITAT | -823.9 | 5,009.0 | 7,667.3 | 13,708.0 | 9,777.6 | 7,405.1 | 8,329.6 | 9,369.4 | 10,539.1 | 11,854.8 |
| Depreciation | ||||||||||
| Changes in Account Receivables | ||||||||||
| Changes in Inventories | ||||||||||
| Changes in Accounts Payable | ||||||||||
| Capital Expenditure | ||||||||||
| UFCF | -15,859.9 | 3,242.0 | 513.3 | 9,947.0 | 21,056.6 | 310.2 | 5,949.5 | 6,692.2 | 7,527.6 | 8,467.4 |
| WACC, % | 4.38 | 4.53 | 4.54 | 4.57 | 4.54 | 4.51 | 4.51 | 4.51 | 4.51 | 4.51 |
| PV UFCF | ||||||||||
| SUM PV UFCF | 24,705.2 | |||||||||
| Long Term Growth Rate, % | 3.00 | |||||||||
| Free cash flow (T + 1) | 8,721 | |||||||||
| Terminal Value | 576,348 | |||||||||
| Present Terminal Value | 462,198 | |||||||||
| Enterprise Value | 486,904 | |||||||||
| Net Debt | -12,184 | |||||||||
| Equity Value | 499,088 | |||||||||
| Diluted Shares Outstanding, MM | 46 | |||||||||
| Equity Value Per Share | 10,845.31 |
What You Will Get
- Authentic Adastria Data: Comprehensive financials – from revenue to EBIT – based on both actual and forecasted figures.
- Complete Customization: Modify all essential parameters (yellow cells) such as WACC, growth %, and tax rates.
- Instant Valuation Updates: Automatic recalculations to assess the effects of changes on Adastria’s fair value.
- Flexible Excel Template: Designed for easy edits, scenario analysis, and thorough projections.
- Efficient and Precise: Avoid starting models from scratch while ensuring accuracy and adaptability.
Core Advantages
- Authentic Adastria Financials: Gain access to reliable historical data and future forecasts specific to Adastria Co., Ltd. (2685T).
- Adjustable Forecast Parameters: Modify the yellow-highlighted fields, including WACC, growth rates, and profit margins.
- Real-Time Calculations: Automatic recalculations of DCF, Net Present Value (NPV), and cash flow metrics.
- Interactive Dashboard: User-friendly charts and summaries for a clear visualization of your valuation findings.
- Designed for All Users: A straightforward, intuitive layout tailored for investors, CFOs, and consultants alike.
How It Functions
- 1. Access the Template: Download and open the Excel file containing Adastria Co., Ltd.'s preloaded data.
- 2. Modify Assumptions: Update essential inputs such as growth rates, WACC, and capital expenditures.
- 3. See Immediate Results: The DCF model automatically calculates intrinsic value and NPV in real-time.
- 4. Explore Scenarios: Evaluate various forecasts to assess different valuation scenarios.
- 5. Present with Assurance: Deliver expert valuation insights to reinforce your decision-making.
Why Choose This Calculator for Adastria Co., Ltd. (2685T)?
- All-in-One Solution: Features comprehensive analyses including DCF, WACC, and various financial ratios.
- Adjustable Parameters: Modify the yellow-highlighted cells to explore different financial scenarios.
- In-Depth Analysis: Automatically computes Adastria's intrinsic value and Net Present Value.
- Preloaded Information: Historical and projected data provide a solid foundation for your assessments.
- High Standards: Perfect for financial analysts, investors, and business consultants focused on Adastria Co., Ltd. (2685T).
Who Can Benefit from This Product?
- Investors: Assess Adastria’s valuation before making stock trades.
- CFOs and Financial Analysts: Optimize valuation procedures and evaluate forecasts.
- Startup Founders: Understand the valuation methods used for leading companies like Adastria.
- Consultants: Provide clients with comprehensive valuation reports.
- Students and Educators: Utilize real-market data to enhance learning and application of valuation strategies.
What the Template Includes
- Detailed DCF Model: Editable template featuring comprehensive valuation calculations.
- Current Market Data: Adastria Co., Ltd.’s historical and forecasted financials preloaded for in-depth analysis.
- Adjustable Assumptions: Modify WACC, growth rates, and tax rates to explore various scenarios.
- Financial Statements: Complete annual and quarterly breakdowns for enhanced understanding.
- Key Financial Ratios: Integrated analysis for profitability, operational efficiency, and financial leverage.
- Interactive Dashboard: Visual charts and tables for clear and actionable insights.
Disclaimer
All information, articles, and product details provided on this website are for general informational and educational purposes only. We do not claim any ownership over, nor do we intend to infringe upon, any trademarks, copyrights, logos, brand names, or other intellectual property mentioned or depicted on this site. Such intellectual property remains the property of its respective owners, and any references here are made solely for identification or informational purposes, without implying any affiliation, endorsement, or partnership.
We make no representations or warranties, express or implied, regarding the accuracy, completeness, or suitability of any content or products presented. Nothing on this website should be construed as legal, tax, investment, financial, medical, or other professional advice. In addition, no part of this site—including articles or product references—constitutes a solicitation, recommendation, endorsement, advertisement, or offer to buy or sell any securities, franchises, or other financial instruments, particularly in jurisdictions where such activity would be unlawful.
All content is of a general nature and may not address the specific circumstances of any individual or entity. It is not a substitute for professional advice or services. Any actions you take based on the information provided here are strictly at your own risk. You accept full responsibility for any decisions or outcomes arising from your use of this website and agree to release us from any liability in connection with your use of, or reliance upon, the content or products found herein.