
|
Kura Sushi, inc. (2695.T) Avaliação do DCF |
Totalmente Editável: Adapte-Se Às Suas Necessidades No Excel Ou Planilhas
Design Profissional: Modelos Confiáveis E Padrão Da Indústria
Pré-Construídos Para Uso Rápido E Eficiente
Compatível com MAC/PC, totalmente desbloqueado
Não É Necessária Experiência; Fácil De Seguir
Kura Sushi,Inc. (2695.T) Bundle
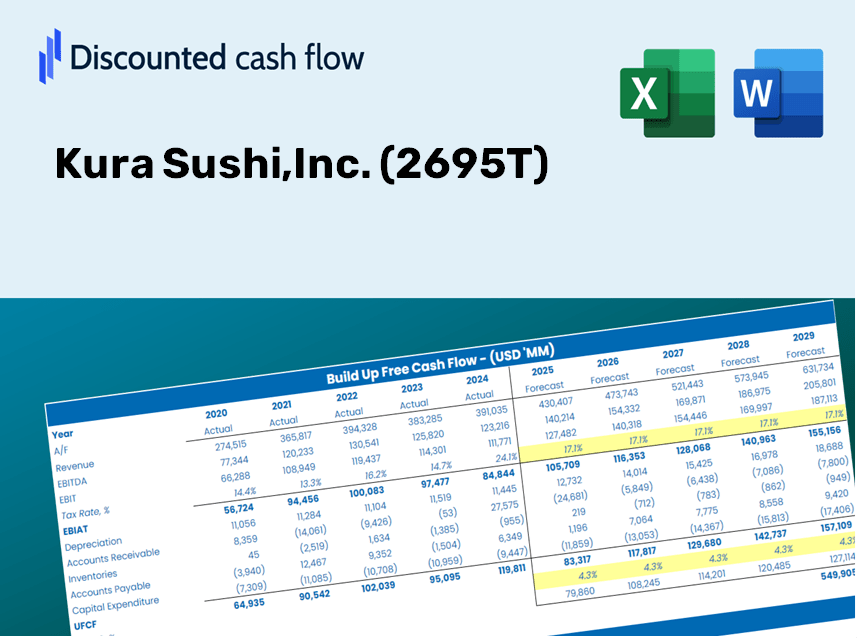
Simplifique sua análise e aumente a precisão com a nossa calculadora DCF (2695T)! Utilizando dados reais de sushi kura e suposições personalizáveis, essa ferramenta permite que você preveja, avalie e valorize o Kura Sushi como um investidor especialista.
Discounted Cash Flow (DCF) - (USD MM)
| Year | AY1 2020 |
AY2 2021 |
AY3 2022 |
AY4 2023 |
AY5 2024 |
FY1 2025 |
FY2 2026 |
FY3 2027 |
FY4 2028 |
FY5 2029 |
|---|---|---|---|---|---|---|---|---|---|---|
| Revenue | 135,835.0 | 147,592.0 | 183,053.0 | 211,405.0 | 234,950.0 | 269,785.8 | 309,786.6 | 355,718.3 | 408,460.2 | 469,022.1 |
| Revenue Growth, % | 0 | 8.66 | 24.03 | 15.49 | 11.14 | 14.83 | 14.83 | 14.83 | 14.83 | 14.83 |
| EBITDA | 5,641.0 | 9,353.0 | 9,759.0 | 11,320.0 | 15,238.0 | 14,925.3 | 17,138.3 | 19,679.3 | 22,597.2 | 25,947.6 |
| EBITDA, % | 4.15 | 6.34 | 5.33 | 5.35 | 6.49 | 5.53 | 5.53 | 5.53 | 5.53 | 5.53 |
| Depreciation | 5,290.0 | 6,269.0 | 7,631.0 | 8,837.0 | 10,532.0 | 11,316.7 | 12,994.6 | 14,921.3 | 17,133.7 | 19,674.0 |
| Depreciation, % | 3.89 | 4.25 | 4.17 | 4.18 | 4.48 | 4.19 | 4.19 | 4.19 | 4.19 | 4.19 |
| EBIT | 351.0 | 3,084.0 | 2,128.0 | 2,483.0 | 4,706.0 | 3,608.6 | 4,143.7 | 4,758.1 | 5,463.5 | 6,273.6 |
| EBIT, % | 0.2584 | 2.09 | 1.16 | 1.17 | 2 | 1.34 | 1.34 | 1.34 | 1.34 | 1.34 |
| Total Cash | 20,611.0 | 18,748.0 | 13,169.0 | 20,188.0 | 23,043.0 | 29,367.4 | 33,721.7 | 38,721.6 | 44,462.8 | 51,055.2 |
| Total Cash, percent | .0 | .0 | .0 | .0 | .0 | .0 | .0 | .0 | .0 | .0 |
| Account Receivables | 3,854.0 | 3,554.0 | 4,642.0 | 5,162.0 | 5,672.0 | 6,818.6 | 7,829.6 | 8,990.4 | 10,323.4 | 11,854.1 |
| Account Receivables, % | 2.84 | 2.41 | 2.54 | 2.44 | 2.41 | 2.53 | 2.53 | 2.53 | 2.53 | 2.53 |
| Inventories | 1,715.0 | 1,798.0 | 2,410.0 | 2,522.0 | 3,016.0 | 3,385.3 | 3,887.2 | 4,463.5 | 5,125.4 | 5,885.3 |
| Inventories, % | 1.26 | 1.22 | 1.32 | 1.19 | 1.28 | 1.25 | 1.25 | 1.25 | 1.25 | 1.25 |
| Accounts Payable | 6,509.0 | 6,086.0 | 6,609.0 | 7,065.0 | 8,150.0 | 10,433.5 | 11,980.4 | 13,756.7 | 15,796.4 | 18,138.5 |
| Accounts Payable, % | 4.79 | 4.12 | 3.61 | 3.34 | 3.47 | 3.87 | 3.87 | 3.87 | 3.87 | 3.87 |
| Capital Expenditure | -7,232.0 | -8,415.0 | -10,530.0 | -12,314.0 | -10,583.0 | -14,626.3 | -16,794.9 | -19,285.1 | -22,144.5 | -25,427.8 |
| Capital Expenditure, % | -5.32 | -5.7 | -5.75 | -5.82 | -4.5 | -5.42 | -5.42 | -5.42 | -5.42 | -5.42 |
| Tax Rate, % | 25.65 | 25.65 | 25.65 | 25.65 | 25.65 | 25.65 | 25.65 | 25.65 | 25.65 | 25.65 |
| EBITAT | -210.3 | 2,005.7 | 831.1 | 969.6 | 3,498.9 | 1,569.7 | 1,802.4 | 2,069.7 | 2,376.5 | 2,728.9 |
| Depreciation | ||||||||||
| Changes in Account Receivables | ||||||||||
| Changes in Inventories | ||||||||||
| Changes in Accounts Payable | ||||||||||
| Capital Expenditure | ||||||||||
| UFCF | -1,212.3 | -346.3 | -3,244.9 | -2,683.4 | 3,528.9 | -972.3 | -1,963.9 | -2,255.1 | -2,589.4 | -2,973.3 |
| WACC, % | 3.62 | 4.16 | 3.95 | 3.95 | 4.23 | 3.98 | 3.98 | 3.98 | 3.98 | 3.98 |
| PV UFCF | ||||||||||
| SUM PV UFCF | -9,418.3 | |||||||||
| Long Term Growth Rate, % | 3.40 | |||||||||
| Free cash flow (T + 1) | -3,074 | |||||||||
| Terminal Value | -528,518 | |||||||||
| Present Terminal Value | -434,785 | |||||||||
| Enterprise Value | -444,203 | |||||||||
| Net Debt | 14,417 | |||||||||
| Equity Value | -458,620 | |||||||||
| Diluted Shares Outstanding, MM | 40 | |||||||||
| Equity Value Per Share | -11,540.13 |
What You Will Receive
- Pre-Filled Financial Model: Utilize Kura Sushi, Inc.'s actual data for an accurate DCF valuation.
- Comprehensive Forecast Control: Customize revenue growth, profit margins, WACC, and other critical factors.
- Real-Time Calculations: Automatic updates to ensure immediate visibility of results with any adjustments.
- Investor-Ready Template: A polished Excel file crafted for high-quality valuation processes.
- Customizable and Reusable: Designed for versatility, allowing for repeated application in detailed forecasts.
Key Features
- Pre-Loaded Data: Kura Sushi, Inc.'s historical financial statements and pre-filled forecasts.
- Fully Adjustable Inputs: Customize WACC, tax rates, revenue growth, and EBITDA margins.
- Instant Results: Observe Kura Sushi, Inc.'s intrinsic value recalculating in real time.
- Clear Visual Outputs: Dashboard charts showcase valuation results and essential metrics.
- Built for Accuracy: A professional-grade tool designed for analysts, investors, and finance professionals.
How It Works
- 1. Access the Template: Download and open the Excel file featuring Kura Sushi, Inc. (2695T)'s preloaded data.
- 2. Modify Assumptions: Adjust critical inputs such as growth rates, WACC, and capital expenditures.
- 3. View Results in Real-Time: The DCF model automatically calculates intrinsic value and NPV.
- 4. Explore Various Scenarios: Evaluate multiple forecasts to assess different valuation results.
- 5. Present with Assurance: Share professional valuation insights to inform your strategic decisions.
Why Opt for This Calculator?
- All-in-One Solution: Combines DCF, WACC, and key financial ratio analyses in a single tool.
- Flexible Inputs: Modify the yellow-highlighted cells to explore different scenarios.
- In-Depth Analysis: Automatically computes Kura Sushi’s intrinsic value and Net Present Value.
- Integrated Data: Comes with historical and projected data for reliable baseline calculations.
- High Standards: Perfect for financial analysts, investors, and business consultants alike.
Who Should Consider Kura Sushi, Inc. (2695T)?
- Investors: Make informed decisions with a professional-grade analysis of Kura Sushi's market performance.
- Financial Analysts: Streamline your evaluations using a comprehensive financial model specifically designed for Kura Sushi, Inc. (2695T).
- Consultants: Tailor the provided templates to enhance client presentations or reports related to Kura Sushi, Inc. (2695T).
- Food Industry Enthusiasts: Expand your knowledge of restaurant valuation techniques through insightful, real-world applications focused on Kura Sushi, Inc. (2695T).
- Educators and Students: Utilize this resource as a hands-on learning tool in courses related to finance and the restaurant industry.
What the Template Includes
- Preloaded Kura Sushi Data: Historical and projected financial metrics, such as revenue, EBIT, and capital expenditures.
- DCF and WACC Models: High-quality spreadsheets designed for calculating intrinsic value and Weighted Average Cost of Capital.
- Editable Inputs: Cells highlighted in yellow for modifying revenue growth, tax rates, and discount rates.
- Financial Statements: Detailed annual and quarterly financial reports for enhanced analysis.
- Key Ratios: Metrics for profitability, leverage, and efficiency to assess performance.
- Dashboard and Charts: Visual representations of valuation results and underlying assumptions.
Disclaimer
All information, articles, and product details provided on this website are for general informational and educational purposes only. We do not claim any ownership over, nor do we intend to infringe upon, any trademarks, copyrights, logos, brand names, or other intellectual property mentioned or depicted on this site. Such intellectual property remains the property of its respective owners, and any references here are made solely for identification or informational purposes, without implying any affiliation, endorsement, or partnership.
We make no representations or warranties, express or implied, regarding the accuracy, completeness, or suitability of any content or products presented. Nothing on this website should be construed as legal, tax, investment, financial, medical, or other professional advice. In addition, no part of this site—including articles or product references—constitutes a solicitation, recommendation, endorsement, advertisement, or offer to buy or sell any securities, franchises, or other financial instruments, particularly in jurisdictions where such activity would be unlawful.
All content is of a general nature and may not address the specific circumstances of any individual or entity. It is not a substitute for professional advice or services. Any actions you take based on the information provided here are strictly at your own risk. You accept full responsibility for any decisions or outcomes arising from your use of this website and agree to release us from any liability in connection with your use of, or reliance upon, the content or products found herein.