
|
Kikkoman Corporation (2801.T) Avaliação DCF |
Totalmente Editável: Adapte-Se Às Suas Necessidades No Excel Ou Planilhas
Design Profissional: Modelos Confiáveis E Padrão Da Indústria
Pré-Construídos Para Uso Rápido E Eficiente
Compatível com MAC/PC, totalmente desbloqueado
Não É Necessária Experiência; Fácil De Seguir
Kikkoman Corporation (2801.T) Bundle
Procurando determinar o valor intrínseco da Kikkoman Corporation? Nossa calculadora DCF (2801T) integra dados do mundo real com opções completas de personalização, permitindo ajustar as previsões e aprimorar suas estratégias de investimento.
What You Will Receive
- Authentic Kikkoman Financial Data: Pre-loaded with Kikkoman's historical and forecasted data for thorough analysis.
- Completely Customizable Template: Easily adjust crucial inputs such as revenue growth, WACC, and EBITDA %.
- Instant Calculations: Watch Kikkoman’s intrinsic value update in real time as you make changes.
- Expert Valuation Tool: Tailored for investors, analysts, and consultants seeking reliable DCF results.
- Intuitive Design: Clear layout and straightforward instructions suitable for all skill levels.
Key Features
- Pre-Loaded Data: Kikkoman Corporation’s historical financial statements and pre-filled forecasts.
- Fully Adjustable Inputs: Modify WACC, tax rates, revenue growth, and EBITDA margins as needed.
- Instant Results: View Kikkoman Corporation’s intrinsic value recalculating in real time.
- Clear Visual Outputs: Dashboard charts showcase valuation results and important metrics.
- Built for Accuracy: A professional tool designed for analysts, investors, and finance experts.
How It Works
- Step 1: Download the Excel file.
- Step 2: Review the pre-filled Kikkoman data (historical and projected).
- Step 3: Modify key assumptions (yellow cells) according to your analysis.
- Step 4: Observe the automatic recalculations for Kikkoman's intrinsic value.
- Step 5: Utilize the results for investment decisions or reporting purposes.
Why Opt for Kikkoman's Calculator?
- Time-Efficient: Skip the hassle of building a DCF model from the ground up – it’s immediately available for your use.
- Enhanced Accuracy: Dependable financial data and formulas minimize valuation errors.
- Completely Customizable: Adjust the model to align with your own assumptions and forecasts.
- User-Friendly: Intuitive charts and outputs simplify the analysis of results.
- Endorsed by Professionals: Crafted for those who prioritize precision and functionality.
Who Can Benefit from This Product?
- Finance Students: Master valuation methods and apply them using real-time data.
- Academics: Utilize industry-standard models in your teaching or research projects.
- Investors: Validate your investment hypotheses and examine valuation scenarios for Kikkoman Corporation (2801T).
- Analysts: Enhance your analysis efficiency with a ready-to-use, customizable DCF model.
- Small Business Owners: Understand how major public companies like Kikkoman Corporation (2801T) are evaluated.
Contents of the Template
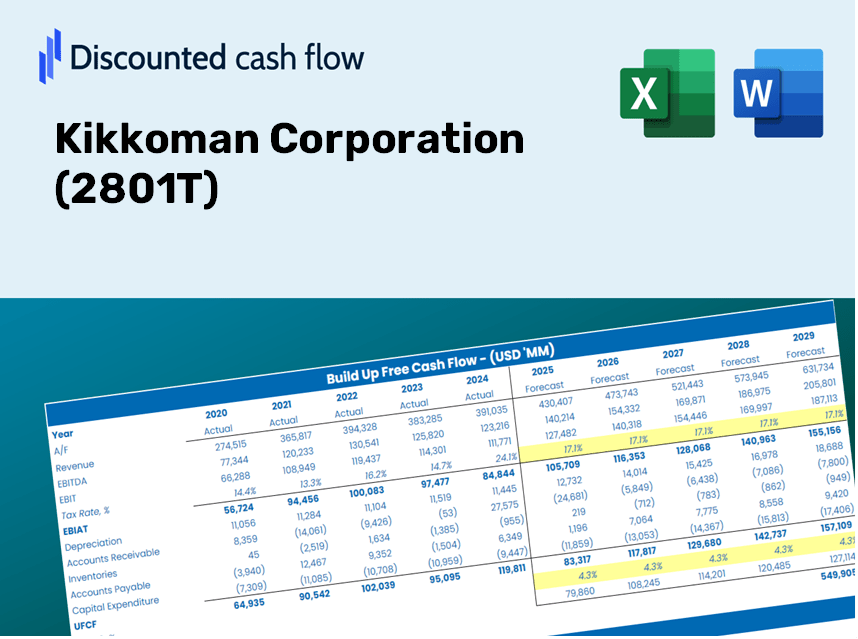
- Operating and Balance Sheet Data: Pre-filled historical data and forecasts for Kikkoman Corporation (2801T), including revenue, EBITDA, EBIT, and capital expenditures.
- WACC Calculation: A dedicated sheet for the Weighted Average Cost of Capital (WACC), featuring parameters such as Beta, risk-free rate, and share price.
- DCF Valuation (Unlevered and Levered): Customizable Discounted Cash Flow models that illustrate intrinsic value along with comprehensive calculations.
- Financial Statements: Pre-loaded annual and quarterly financial statements to facilitate thorough analysis.
- Key Ratios: A collection of profitability, leverage, and efficiency ratios specific to Kikkoman Corporation (2801T).
- Dashboard and Charts: A visual summary of valuation outputs and assumptions, designed for easy analysis of results.
Disclaimer
All information, articles, and product details provided on this website are for general informational and educational purposes only. We do not claim any ownership over, nor do we intend to infringe upon, any trademarks, copyrights, logos, brand names, or other intellectual property mentioned or depicted on this site. Such intellectual property remains the property of its respective owners, and any references here are made solely for identification or informational purposes, without implying any affiliation, endorsement, or partnership.
We make no representations or warranties, express or implied, regarding the accuracy, completeness, or suitability of any content or products presented. Nothing on this website should be construed as legal, tax, investment, financial, medical, or other professional advice. In addition, no part of this site—including articles or product references—constitutes a solicitation, recommendation, endorsement, advertisement, or offer to buy or sell any securities, franchises, or other financial instruments, particularly in jurisdictions where such activity would be unlawful.
All content is of a general nature and may not address the specific circumstances of any individual or entity. It is not a substitute for professional advice or services. Any actions you take based on the information provided here are strictly at your own risk. You accept full responsibility for any decisions or outcomes arising from your use of this website and agree to release us from any liability in connection with your use of, or reliance upon, the content or products found herein.