
|
Pequim Ultrapower Software Co., Ltd. (300002.SZ) Avaliação DCF |
Totalmente Editável: Adapte-Se Às Suas Necessidades No Excel Ou Planilhas
Design Profissional: Modelos Confiáveis E Padrão Da Indústria
Pré-Construídos Para Uso Rápido E Eficiente
Compatível com MAC/PC, totalmente desbloqueado
Não É Necessária Experiência; Fácil De Seguir
Beijing Ultrapower Software Co., Ltd. (300002.SZ) Bundle
Explore as perspectivas financeiras da Pequim Ultrapower Software Co., Ltd. (300002SZ) usando nossa calculadora DCF amigável! Digite suas projeções de crescimento, margens e despesas para calcular o valor intrínseco da Beijing Ultrapower Software Co., Ltd. (300002SZ) e informe suas decisões de investimento.
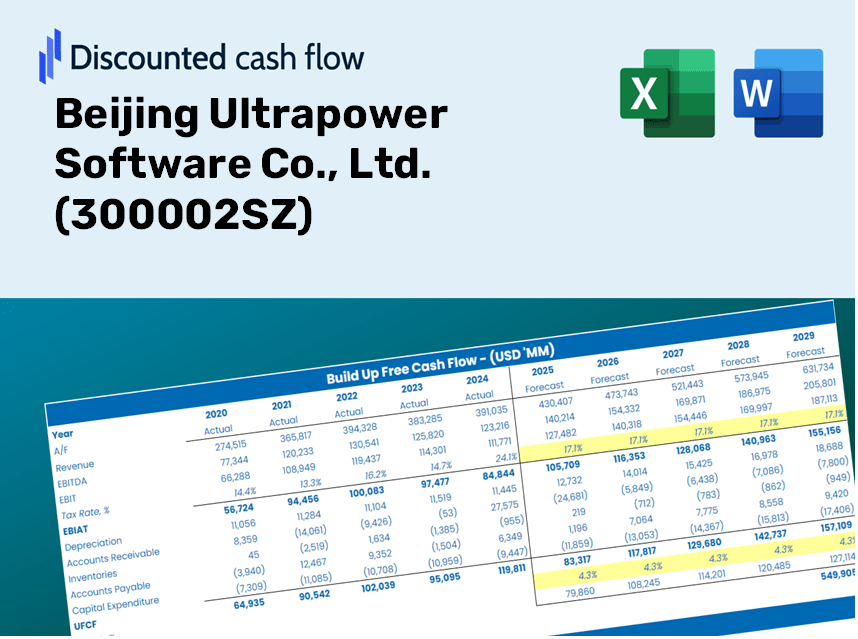
Discounted Cash Flow (DCF) - (USD MM)
| Year | AY1 2020 |
AY2 2021 |
AY3 2022 |
AY4 2023 |
AY5 2024 |
FY1 2025 |
FY2 2026 |
FY3 2027 |
FY4 2028 |
FY5 2029 |
|---|---|---|---|---|---|---|---|---|---|---|
| Revenue | 3,595.8 | 4,314.3 | 4,806.0 | 5,962.2 | 6,452.4 | 6,028.6 | 5,632.6 | 5,262.6 | 4,916.9 | 4,593.9 |
| Revenue Growth, % | 0 | 19.98 | 11.4 | 24.06 | 8.22 | -6.57 | -6.57 | -6.57 | -6.57 | -6.57 |
| EBITDA | 598.7 | 682.9 | 794.1 | 1,208.4 | 1,762.5 | 1,164.6 | 1,088.1 | 1,016.6 | 949.8 | 887.4 |
| EBITDA, % | 16.65 | 15.83 | 16.52 | 20.27 | 27.32 | 19.32 | 19.32 | 19.32 | 19.32 | 19.32 |
| Depreciation | 109.0 | 136.4 | 159.7 | 154.7 | 127.5 | 169.8 | 158.7 | 148.3 | 138.5 | 129.4 |
| Depreciation, % | 3.03 | 3.16 | 3.32 | 2.6 | 1.98 | 2.82 | 2.82 | 2.82 | 2.82 | 2.82 |
| EBIT | 489.7 | 546.5 | 634.4 | 1,053.7 | 1,635.1 | 994.7 | 929.4 | 868.3 | 811.3 | 758.0 |
| EBIT, % | 13.62 | 12.67 | 13.2 | 17.67 | 25.34 | 16.5 | 16.5 | 16.5 | 16.5 | 16.5 |
| Total Cash | 1,022.3 | 968.3 | 1,865.8 | 2,734.1 | 2,561.1 | 2,113.0 | 1,974.2 | 1,844.5 | 1,723.3 | 1,610.1 |
| Total Cash, percent | .0 | .0 | .0 | .0 | .0 | .0 | .0 | .0 | .0 | .0 |
| Account Receivables | 642.9 | 765.7 | 701.8 | 845.6 | 937.6 | 951.8 | 889.3 | 830.9 | 776.3 | 725.3 |
| Account Receivables, % | 17.88 | 17.75 | 14.6 | 14.18 | 14.53 | 15.79 | 15.79 | 15.79 | 15.79 | 15.79 |
| Inventories | 208.4 | 154.8 | 163.0 | 165.7 | 152.5 | 216.0 | 201.8 | 188.6 | 176.2 | 164.6 |
| Inventories, % | 5.8 | 3.59 | 3.39 | 2.78 | 2.36 | 3.58 | 3.58 | 3.58 | 3.58 | 3.58 |
| Accounts Payable | 386.3 | 311.2 | 397.4 | 385.5 | 392.7 | 467.5 | 436.8 | 408.1 | 381.3 | 356.3 |
| Accounts Payable, % | 10.74 | 7.21 | 8.27 | 6.47 | 6.09 | 7.76 | 7.76 | 7.76 | 7.76 | 7.76 |
| Capital Expenditure | -74.3 | -186.6 | -101.7 | -169.1 | -163.9 | -167.4 | -156.4 | -146.1 | -136.5 | -127.6 |
| Capital Expenditure, % | -2.07 | -4.33 | -2.12 | -2.84 | -2.54 | -2.78 | -2.78 | -2.78 | -2.78 | -2.78 |
| Tax Rate, % | 12.59 | 12.59 | 12.59 | 12.59 | 12.59 | 12.59 | 12.59 | 12.59 | 12.59 | 12.59 |
| EBITAT | 417.0 | 449.0 | 545.9 | 889.1 | 1,429.2 | 845.8 | 790.2 | 738.3 | 689.8 | 644.5 |
| Depreciation | ||||||||||
| Changes in Account Receivables | ||||||||||
| Changes in Inventories | ||||||||||
| Changes in Accounts Payable | ||||||||||
| Capital Expenditure | ||||||||||
| UFCF | -13.3 | 254.5 | 745.8 | 716.4 | 1,321.1 | 845.3 | 838.5 | 783.4 | 732.0 | 683.9 |
| WACC, % | 5.5 | 5.5 | 5.5 | 5.5 | 5.5 | 5.5 | 5.5 | 5.5 | 5.5 | 5.5 |
| PV UFCF | ||||||||||
| SUM PV UFCF | 3,336.2 | |||||||||
| Long Term Growth Rate, % | 3.50 | |||||||||
| Free cash flow (T + 1) | 708 | |||||||||
| Terminal Value | 35,442 | |||||||||
| Present Terminal Value | 27,121 | |||||||||
| Enterprise Value | 30,458 | |||||||||
| Net Debt | -1,805 | |||||||||
| Equity Value | 32,263 | |||||||||
| Diluted Shares Outstanding, MM | 1,959 | |||||||||
| Equity Value Per Share | 16.47 |
What You'll Receive
- Authentic (300002SZ) Financial Data: Pre-loaded with Beijing Ultrapower's historical and projected figures for accurate evaluation.
- Completely Customizable Template: Effortlessly adjust key metrics such as revenue growth, WACC, and EBITDA percentages.
- Instant Calculations: Watch the intrinsic value of (300002SZ) update in real-time as you modify inputs.
- Expert Valuation Tool: Crafted for investors, analysts, and consultants aiming for precise DCF outcomes.
- Intuitive Interface: Clear layout and straightforward instructions suitable for all skill levels.
Main Highlights
- Authentic Financial Data: Gain access to reliable, pre-loaded historical figures and future forecasts for Beijing Ultrapower Software Co., Ltd. (300002SZ).
- Personalizable Forecast Inputs: Modify highlighted cells for parameters like WACC, growth rates, and profit margins.
- Automated Calculations: Instantly update DCF, Net Present Value (NPV), and cash flow analyses with ease.
- Interactive Dashboard: User-friendly charts and summaries that help you visualize your valuation outcomes.
- Suitable for All Users: A straightforward and intuitive layout designed for investors, CFOs, and consultants alike.
How It Works
- Step 1: Download the Excel file for Beijing Ultrapower Software Co., Ltd. (300002SZ).
- Step 2: Examine the pre-filled financial data and projections for the company.
- Step 3: Adjust key parameters such as revenue growth, WACC, and tax rates (indicated in highlighted cells).
- Step 4: Observe the DCF model refresh in real-time as you change your assumptions.
- Step 5: Evaluate the results and utilize them for making informed investment choices.
Why Choose Beijing Ultrapower Software Co., Ltd. (300002SZ) Calculator?
- Reliable Data: Leverage authentic financial metrics from Beijing Ultrapower for trustworthy valuation outcomes.
- Fully Customizable: Modify essential factors such as growth projections, WACC, and tax rates to align with your forecasts.
- Efficiency-Boosting: Pre-configured calculations save you the hassle of starting from scratch.
- Industry-Standard Tool: Tailored for investors, analysts, and consultants seeking precision.
- User-Friendly Design: An intuitive interface and guided instructions ensure accessibility for all users.
Who Can Benefit from This Product?
- Investors: Precisely assess the fair value of Beijing Ultrapower Software Co., Ltd. (300002SZ) before making investment choices.
- CFOs: Utilize a high-quality DCF model for comprehensive financial reporting and analysis.
- Consultants: Efficiently modify the template for client valuation reports.
- Entrepreneurs: Acquire insights into the financial modeling practices of leading firms.
- Educators: Employ it as a resource to illustrate valuation techniques in the classroom.
Contents of the Template
- Pre-Filled Data: Features Beijing Ultrapower Software Co., Ltd.'s historical financials and projections.
- Discounted Cash Flow Model: An editable DCF valuation model with automated calculations.
- Weighted Average Cost of Capital (WACC): A specialized sheet for calculating WACC using custom inputs.
- Key Financial Ratios: Assess Beijing Ultrapower Software Co., Ltd.'s profitability, efficiency, and leverage.
- Customizable Inputs: Easily modify revenue growth, profit margins, and tax rates.
- Clear Dashboard: Visual charts and tables summarizing essential valuation outcomes.
Disclaimer
All information, articles, and product details provided on this website are for general informational and educational purposes only. We do not claim any ownership over, nor do we intend to infringe upon, any trademarks, copyrights, logos, brand names, or other intellectual property mentioned or depicted on this site. Such intellectual property remains the property of its respective owners, and any references here are made solely for identification or informational purposes, without implying any affiliation, endorsement, or partnership.
We make no representations or warranties, express or implied, regarding the accuracy, completeness, or suitability of any content or products presented. Nothing on this website should be construed as legal, tax, investment, financial, medical, or other professional advice. In addition, no part of this site—including articles or product references—constitutes a solicitation, recommendation, endorsement, advertisement, or offer to buy or sell any securities, franchises, or other financial instruments, particularly in jurisdictions where such activity would be unlawful.
All content is of a general nature and may not address the specific circumstances of any individual or entity. It is not a substitute for professional advice or services. Any actions you take based on the information provided here are strictly at your own risk. You accept full responsibility for any decisions or outcomes arising from your use of this website and agree to release us from any liability in connection with your use of, or reliance upon, the content or products found herein.