
|
Anhui Anke Biotechnology Co., Ltd. (300009.SZ) Avaliação DCF |
Totalmente Editável: Adapte-Se Às Suas Necessidades No Excel Ou Planilhas
Design Profissional: Modelos Confiáveis E Padrão Da Indústria
Pré-Construídos Para Uso Rápido E Eficiente
Compatível com MAC/PC, totalmente desbloqueado
Não É Necessária Experiência; Fácil De Seguir
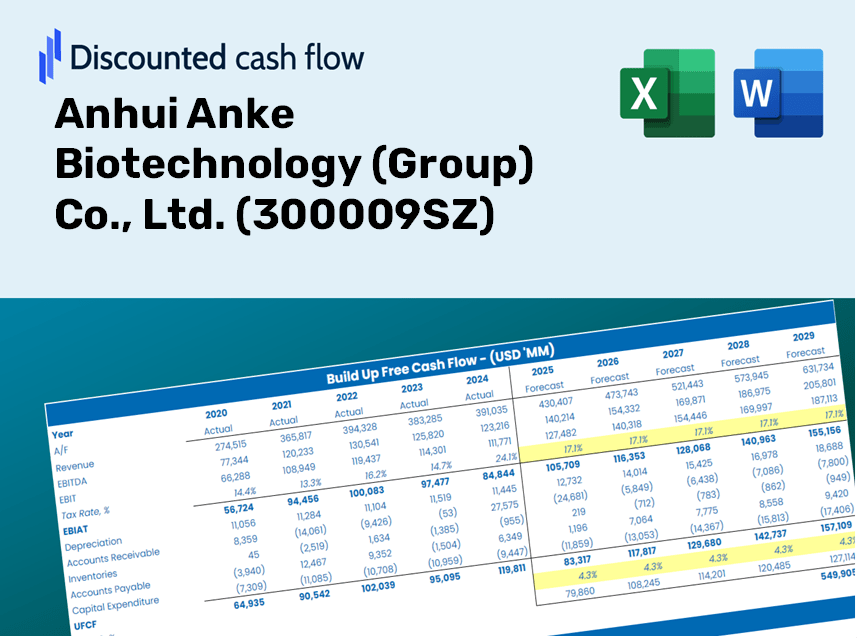
Anhui Anke Biotechnology (Group) Co., Ltd. (300009.SZ) Bundle
Aprimore suas estratégias de investimento com a calculadora DCF (3009SZ)! Explore a genuína Anhui Anke Biotechnology (Group) Co., Ltd. Dados financeiros, ajuste as projeções e despesas de crescimento e observe instantaneamente como essas modificações afetam o valor intrínseco de (300009SZ).
Discounted Cash Flow (DCF) - (USD MM)
| Year | AY1 2020 |
AY2 2021 |
AY3 2022 |
AY4 2023 |
AY5 2024 |
FY1 2025 |
FY2 2026 |
FY3 2027 |
FY4 2028 |
FY5 2029 |
|---|---|---|---|---|---|---|---|---|---|---|
| Revenue | 1,701.4 | 2,168.8 | 2,331.1 | 2,865.8 | 2,536.0 | 2,830.1 | 3,158.3 | 3,524.5 | 3,933.2 | 4,389.3 |
| Revenue Growth, % | 0 | 27.47 | 7.48 | 22.94 | -11.51 | 11.6 | 11.6 | 11.6 | 11.6 | 11.6 |
| EBITDA | 462.7 | 676.7 | 836.2 | 993.4 | 846.1 | 918.6 | 1,025.2 | 1,144.0 | 1,276.7 | 1,424.7 |
| EBITDA, % | 27.19 | 31.2 | 35.87 | 34.67 | 33.36 | 32.46 | 32.46 | 32.46 | 32.46 | 32.46 |
| Depreciation | 66.0 | 77.4 | 80.5 | 80.5 | 86.6 | 96.9 | 108.2 | 120.7 | 134.7 | 150.3 |
| Depreciation, % | 3.88 | 3.57 | 3.45 | 2.81 | 3.42 | 3.43 | 3.43 | 3.43 | 3.43 | 3.43 |
| EBIT | 396.7 | 599.3 | 755.7 | 912.9 | 759.5 | 821.7 | 917.0 | 1,023.3 | 1,142.0 | 1,274.4 |
| EBIT, % | 23.32 | 27.63 | 32.42 | 31.86 | 29.95 | 29.03 | 29.03 | 29.03 | 29.03 | 29.03 |
| Total Cash | 894.5 | 1,128.0 | 1,167.5 | 1,455.8 | 1,443.9 | 1,485.3 | 1,657.5 | 1,849.7 | 2,064.2 | 2,303.6 |
| Total Cash, percent | .0 | .0 | .0 | .0 | .0 | .0 | .0 | .0 | .0 | .0 |
| Account Receivables | 475.6 | 590.8 | 487.5 | 597.4 | 522.8 | 665.5 | 742.7 | 828.8 | 924.9 | 1,032.1 |
| Account Receivables, % | 27.95 | 27.24 | 20.92 | 20.85 | 20.61 | 23.51 | 23.51 | 23.51 | 23.51 | 23.51 |
| Inventories | 155.1 | 181.3 | 210.5 | 235.2 | 297.3 | 262.8 | 293.3 | 327.3 | 365.3 | 407.6 |
| Inventories, % | 9.12 | 8.36 | 9.03 | 8.21 | 11.72 | 9.29 | 9.29 | 9.29 | 9.29 | 9.29 |
| Accounts Payable | 109.3 | 141.1 | 151.0 | 196.8 | 215.0 | 196.7 | 219.5 | 245.0 | 273.4 | 305.1 |
| Accounts Payable, % | 6.43 | 6.51 | 6.48 | 6.87 | 8.48 | 6.95 | 6.95 | 6.95 | 6.95 | 6.95 |
| Capital Expenditure | -138.5 | -131.2 | -474.3 | -195.3 | -117.2 | -260.3 | -290.4 | -324.1 | -361.7 | -403.6 |
| Capital Expenditure, % | -8.14 | -6.05 | -20.35 | -6.82 | -4.62 | -9.2 | -9.2 | -9.2 | -9.2 | -9.2 |
| Tax Rate, % | 11.96 | 11.96 | 11.96 | 11.96 | 11.96 | 11.96 | 11.96 | 11.96 | 11.96 | 11.96 |
| EBITAT | 342.2 | 419.6 | 637.4 | 840.8 | 668.6 | 691.5 | 771.6 | 861.1 | 961.0 | 1,072.4 |
| Depreciation | ||||||||||
| Changes in Account Receivables | ||||||||||
| Changes in Inventories | ||||||||||
| Changes in Accounts Payable | ||||||||||
| Capital Expenditure | ||||||||||
| UFCF | -251.7 | 256.2 | 327.5 | 637.1 | 668.8 | 401.6 | 504.5 | 563.1 | 628.3 | 701.2 |
| WACC, % | 6.07 | 6.07 | 6.07 | 6.07 | 6.07 | 6.07 | 6.07 | 6.07 | 6.07 | 6.07 |
| PV UFCF | ||||||||||
| SUM PV UFCF | 2,317.6 | |||||||||
| Long Term Growth Rate, % | 3.50 | |||||||||
| Free cash flow (T + 1) | 726 | |||||||||
| Terminal Value | 28,252 | |||||||||
| Present Terminal Value | 21,043 | |||||||||
| Enterprise Value | 23,361 | |||||||||
| Net Debt | -256 | |||||||||
| Equity Value | 23,617 | |||||||||
| Diluted Shares Outstanding, MM | 1,683 | |||||||||
| Equity Value Per Share | 14.03 |
What You Will Receive
- Authentic Anhui Anke Data: Preloaded financial metrics – encompassing revenue to EBIT – derived from actual and forecasted data.
- Comprehensive Customization: Modify all essential parameters (yellow cells) such as WACC, growth %, and tax rates.
- Instant Valuation Updates: Automatic recalculations to assess the effects of changes on Anhui Anke’s fair value.
- Flexible Excel Template: Designed for quick adjustments, scenario analysis, and in-depth projections.
- Efficient and Precise: Eliminate the need to construct models from scratch while ensuring accuracy and adaptability.
Key Features
- Customizable Forecast Variables: Adjust essential metrics such as revenue growth, EBITDA percentage, and capital expenditures tailored to Anhui Anke Biotechnology (Group) Co., Ltd. (300009SZ).
- Instant DCF Valuation: Automatically computes intrinsic value, NPV, and additional financial metrics in real-time.
- High-Precision Accuracy: Leverages Anhui Anke's real-world financial data to ensure realistic valuation results.
- Simplified Scenario Analysis: Easily test various assumptions and analyze different outcomes without complications.
- Efficiency Booster: Streamlines the valuation process, eliminating the need for constructing intricate models from the ground up.
How It Works
- Step 1: Download the Excel file.
- Step 2: Review Anhui Anke Biotechnology's pre-filled financial data and projections.
- Step 3: Adjust key inputs such as revenue growth, WACC, and tax rates (highlighted cells).
- Step 4: Observe the DCF model update in real-time as you modify your assumptions.
- Step 5: Evaluate the outputs and apply the findings for your investment decisions.
Why Opt for This Calculator?
- Reliable Data: Genuine Anhui Anke Biotechnology (Group) Co., Ltd. (300009SZ) financials provide dependable valuation outcomes.
- Flexible Options: Modify essential variables such as growth rates, WACC, and tax rates to align with your forecasts.
- Efficiency Boost: Built-in calculations save you time by eliminating the need to start from square one.
- High-Quality Tool: Tailored for investors, analysts, and consultants alike.
- User-Friendly Interface: Streamlined design and clear, step-by-step guidance make it accessible for all users.
Who Can Benefit from Anhui Anke Biotechnology (Group) Co., Ltd. (300009SZ)?
- Investors: Leverage a top-tier valuation tool to make informed investment choices.
- Financial Analysts: Streamline your analysis process with a customizable DCF model at your fingertips.
- Consultants: Effortlessly modify the template for impactful client reports and presentations.
- Finance Enthusiasts: Expand your knowledge of valuation methods through practical, real-life case studies.
- Educators and Students: Incorporate this tool as an engaging resource for finance education and coursework.
Components of the Template
- Pre-Filled DCF Model: Anhui Anke Biotechnology’s financial data preloaded for immediate utilization.
- WACC Calculator: Comprehensive calculations for the Weighted Average Cost of Capital.
- Financial Ratios: Assess Anhui Anke's profitability, leverage, and operational efficiency.
- Editable Inputs: Modify assumptions such as growth rates, profit margins, and capital expenditures to suit your analyses.
- Financial Statements: Annual and quarterly reports available for in-depth examination.
- Interactive Dashboard: Effortlessly visualize key valuation metrics and outcomes.
Disclaimer
All information, articles, and product details provided on this website are for general informational and educational purposes only. We do not claim any ownership over, nor do we intend to infringe upon, any trademarks, copyrights, logos, brand names, or other intellectual property mentioned or depicted on this site. Such intellectual property remains the property of its respective owners, and any references here are made solely for identification or informational purposes, without implying any affiliation, endorsement, or partnership.
We make no representations or warranties, express or implied, regarding the accuracy, completeness, or suitability of any content or products presented. Nothing on this website should be construed as legal, tax, investment, financial, medical, or other professional advice. In addition, no part of this site—including articles or product references—constitutes a solicitation, recommendation, endorsement, advertisement, or offer to buy or sell any securities, franchises, or other financial instruments, particularly in jurisdictions where such activity would be unlawful.
All content is of a general nature and may not address the specific circumstances of any individual or entity. It is not a substitute for professional advice or services. Any actions you take based on the information provided here are strictly at your own risk. You accept full responsibility for any decisions or outcomes arising from your use of this website and agree to release us from any liability in connection with your use of, or reliance upon, the content or products found herein.