
|
Tianjin Chase Sun Pharmaceutical Co., Ltd (300026.sz) Avaliação DCF |
Totalmente Editável: Adapte-Se Às Suas Necessidades No Excel Ou Planilhas
Design Profissional: Modelos Confiáveis E Padrão Da Indústria
Pré-Construídos Para Uso Rápido E Eficiente
Compatível com MAC/PC, totalmente desbloqueado
Não É Necessária Experiência; Fácil De Seguir
Tianjin Chase Sun Pharmaceutical Co.,Ltd (300026.SZ) Bundle
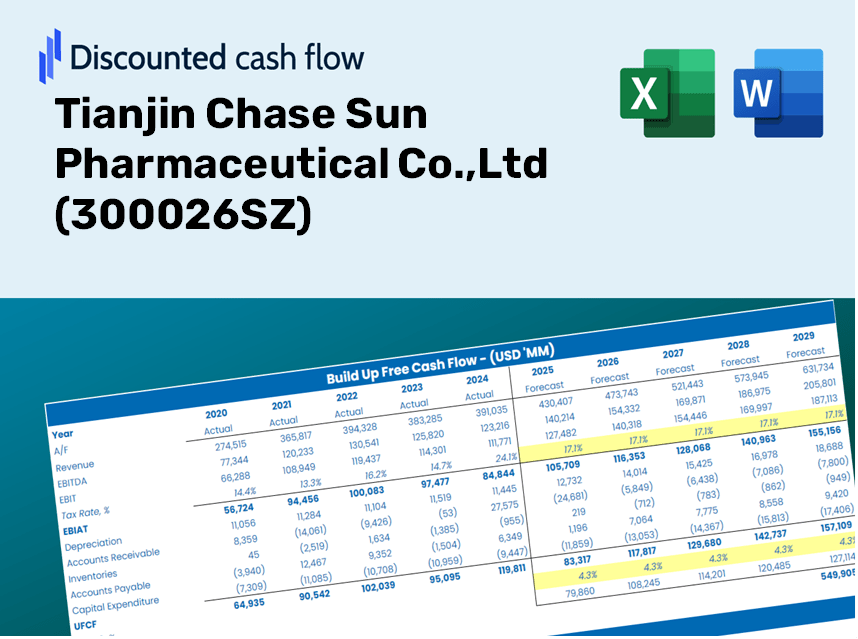
Independentemente de você ser um investidor ou analista, esta calculadora DCF (300026SZ) serve como seu recurso essencial para uma avaliação precisa. Cheio de dados reais da Tianjin Chase Sun Pharmaceutical Co., LTD, você pode ajustar as previsões e observar instantaneamente os efeitos.
Discounted Cash Flow (DCF) - (USD MM)
| Year | AY1 2020 |
AY2 2021 |
AY3 2022 |
AY4 2023 |
AY5 2024 |
FY1 2025 |
FY2 2026 |
FY3 2027 |
FY4 2028 |
FY5 2029 |
|---|---|---|---|---|---|---|---|---|---|---|
| Revenue | 6,488.1 | 7,670.5 | 6,650.0 | 6,108.9 | 5,782.8 | 5,659.1 | 5,538.0 | 5,419.6 | 5,303.7 | 5,190.2 |
| Revenue Growth, % | 0 | 18.22 | -13.3 | -8.14 | -5.34 | -2.14 | -2.14 | -2.14 | -2.14 | -2.14 |
| EBITDA | 924.0 | 1,216.7 | 974.1 | 807.7 | 387.2 | 731.9 | 716.3 | 700.9 | 685.9 | 671.3 |
| EBITDA, % | 14.24 | 15.86 | 14.65 | 13.22 | 6.69 | 12.93 | 12.93 | 12.93 | 12.93 | 12.93 |
| Depreciation | 190.0 | 214.2 | 249.7 | 292.2 | 284.7 | 217.1 | 212.5 | 207.9 | 203.5 | 199.1 |
| Depreciation, % | 2.93 | 2.79 | 3.75 | 4.78 | 4.92 | 3.84 | 3.84 | 3.84 | 3.84 | 3.84 |
| EBIT | 734.0 | 1,002.5 | 724.4 | 515.5 | 102.4 | 514.8 | 503.8 | 493.0 | 482.5 | 472.2 |
| EBIT, % | 11.31 | 13.07 | 10.89 | 8.44 | 1.77 | 9.1 | 9.1 | 9.1 | 9.1 | 9.1 |
| Total Cash | 1,125.8 | 1,316.0 | 1,206.2 | 1,573.6 | 1,306.2 | 1,143.1 | 1,118.6 | 1,094.7 | 1,071.3 | 1,048.4 |
| Total Cash, percent | .0 | .0 | .0 | .0 | .0 | .0 | .0 | .0 | .0 | .0 |
| Account Receivables | 2,852.0 | 3,693.6 | 3,546.3 | 2,942.4 | 2,863.8 | 2,751.8 | 2,692.9 | 2,635.3 | 2,578.9 | 2,523.8 |
| Account Receivables, % | 43.96 | 48.15 | 53.33 | 48.17 | 49.52 | 48.63 | 48.63 | 48.63 | 48.63 | 48.63 |
| Inventories | 1,417.3 | 1,304.5 | 2,213.8 | 1,960.9 | 1,749.4 | 1,522.2 | 1,489.6 | 1,457.8 | 1,426.6 | 1,396.1 |
| Inventories, % | 21.84 | 17.01 | 33.29 | 32.1 | 30.25 | 26.9 | 26.9 | 26.9 | 26.9 | 26.9 |
| Accounts Payable | 809.0 | 605.0 | 849.2 | 666.1 | 678.1 | 631.1 | 617.6 | 604.4 | 591.4 | 578.8 |
| Accounts Payable, % | 12.47 | 7.89 | 12.77 | 10.9 | 11.73 | 11.15 | 11.15 | 11.15 | 11.15 | 11.15 |
| Capital Expenditure | -563.8 | -677.5 | -770.3 | -347.1 | -193.1 | -431.5 | -422.3 | -413.3 | -404.4 | -395.8 |
| Capital Expenditure, % | -8.69 | -8.83 | -11.58 | -5.68 | -3.34 | -7.63 | -7.63 | -7.63 | -7.63 | -7.63 |
| Tax Rate, % | 60.23 | 60.23 | 60.23 | 60.23 | 60.23 | 60.23 | 60.23 | 60.23 | 60.23 | 60.23 |
| EBITAT | 615.8 | 806.7 | 631.3 | 430.4 | 40.7 | 385.9 | 377.6 | 369.5 | 361.6 | 353.9 |
| Depreciation | ||||||||||
| Changes in Account Receivables | ||||||||||
| Changes in Inventories | ||||||||||
| Changes in Accounts Payable | ||||||||||
| Capital Expenditure | ||||||||||
| UFCF | -3,218.2 | -589.4 | -407.2 | 1,049.2 | 434.5 | 463.6 | 245.7 | 240.4 | 235.3 | 230.3 |
| WACC, % | 4.66 | 4.64 | 4.68 | 4.66 | 4.41 | 4.61 | 4.61 | 4.61 | 4.61 | 4.61 |
| PV UFCF | ||||||||||
| SUM PV UFCF | 1,258.0 | |||||||||
| Long Term Growth Rate, % | 4.00 | |||||||||
| Free cash flow (T + 1) | 239 | |||||||||
| Terminal Value | 39,221 | |||||||||
| Present Terminal Value | 31,307 | |||||||||
| Enterprise Value | 32,565 | |||||||||
| Net Debt | -650 | |||||||||
| Equity Value | 33,214 | |||||||||
| Diluted Shares Outstanding, MM | 2,147 | |||||||||
| Equity Value Per Share | 15.47 |
What You Will Receive
- Customizable Excel Template: An adaptable Excel-based DCF Calculator featuring pre-filled financials for Tianjin Chase Sun Pharmaceutical (300026SZ).
- Current Data: Access to historical figures and forward-looking projections (highlighted in the yellow cells).
- Forecast Adaptability: Modify key assumptions such as revenue growth, EBITDA margin, and WACC.
- Instant Calculations: Immediately observe how your inputs affect the valuation of Tianjin Chase Sun Pharmaceutical.
- Professional Grade Tool: Designed for investors, CFOs, consultants, and financial analysts.
- Intuitive Interface: Organized for comprehension and simplicity, complete with step-by-step guidance.
Key Features
- Pre-Loaded Data: Historical financial statements and pre-filled forecasts for Tianjin Chase Sun Pharmaceutical Co., Ltd (300026SZ).
- Fully Adjustable Inputs: Customize WACC, tax rates, revenue growth, and EBITDA margins as needed.
- Instant Results: View the intrinsic value of Tianjin Chase Sun Pharmaceutical Co., Ltd (300026SZ) update in real time.
- Clear Visual Outputs: Dashboard charts present valuation results and essential metrics clearly.
- Built for Accuracy: A professional-grade tool designed for analysts, investors, and finance professionals.
How It Works
- Step 1: Download the prebuilt Excel template containing data for Tianjin Chase Sun Pharmaceutical Co.,Ltd (300026SZ).
- Step 2: Review the pre-filled sheets to familiarize yourself with the essential metrics.
- Step 3: Modify forecasts and assumptions in the editable yellow cells (WACC, growth, margins).
- Step 4: Instantly see the updated results, including the intrinsic value of Tianjin Chase Sun Pharmaceutical Co.,Ltd (300026SZ).
- Step 5: Utilize the outputs to make informed investment decisions or to create reports.
Why Choose This Calculator for Tianjin Chase Sun Pharmaceutical Co., Ltd (300026SZ)?
- All-In-One Tool: Combines DCF, WACC, and comprehensive financial ratio analysis into a single resource.
- Flexible Input Options: Modify the yellow-highlighted fields to explore a variety of scenarios.
- In-Depth Analysis: Automatically assesses the intrinsic value and Net Present Value for Tianjin Chase Sun Pharmaceutical Co., Ltd (300026SZ).
- Preloaded Information: Features historical and projected data for reliable baseline calculations.
- Professional Grade: Perfect for financial analysts, investors, and business consultants in the pharmaceutical sector.
Who Can Benefit from This Product?
- Investors: Precisely evaluate the fair value of Tianjin Chase Sun Pharmaceutical Co., Ltd (300026SZ) before making investment choices.
- CFOs: Utilize a high-quality DCF model for financial analysis and reporting.
- Consultants: Effortlessly customize the template for valuation reports tailored to client needs.
- Entrepreneurs: Acquire insights into the financial modeling practices of leading pharmaceutical firms.
- Educators: Employ it as a teaching resource to illustrate valuation techniques.
Contents of the Template
- Preloaded TCSP Data: Historical and projected financial figures, including revenue, EBIT, and capital expenditures.
- DCF and WACC Models: Professional-grade spreadsheets for calculating intrinsic value and Weighted Average Cost of Capital.
- Editable Inputs: Yellow-highlighted fields for modifying revenue growth, tax rates, and discount rates.
- Financial Statements: Detailed annual and quarterly financial reports for in-depth analysis.
- Key Ratios: Profitability, leverage, and efficiency ratios to assess performance.
- Dashboard and Charts: Visual representations of valuation results and underlying assumptions.
Disclaimer
All information, articles, and product details provided on this website are for general informational and educational purposes only. We do not claim any ownership over, nor do we intend to infringe upon, any trademarks, copyrights, logos, brand names, or other intellectual property mentioned or depicted on this site. Such intellectual property remains the property of its respective owners, and any references here are made solely for identification or informational purposes, without implying any affiliation, endorsement, or partnership.
We make no representations or warranties, express or implied, regarding the accuracy, completeness, or suitability of any content or products presented. Nothing on this website should be construed as legal, tax, investment, financial, medical, or other professional advice. In addition, no part of this site—including articles or product references—constitutes a solicitation, recommendation, endorsement, advertisement, or offer to buy or sell any securities, franchises, or other financial instruments, particularly in jurisdictions where such activity would be unlawful.
All content is of a general nature and may not address the specific circumstances of any individual or entity. It is not a substitute for professional advice or services. Any actions you take based on the information provided here are strictly at your own risk. You accept full responsibility for any decisions or outcomes arising from your use of this website and agree to release us from any liability in connection with your use of, or reliance upon, the content or products found herein.