
|
Wuxi Boton Technology Co., Ltd. (300031.SZ) Avaliação DCF |
Totalmente Editável: Adapte-Se Às Suas Necessidades No Excel Ou Planilhas
Design Profissional: Modelos Confiáveis E Padrão Da Indústria
Pré-Construídos Para Uso Rápido E Eficiente
Compatível com MAC/PC, totalmente desbloqueado
Não É Necessária Experiência; Fácil De Seguir
Wuxi Boton Technology Co., Ltd. (300031.SZ) Bundle
Descubra o verdadeiro potencial da Wuxi Boton Technology Co., Ltd. (300031SZ) com nossa calculadora DCF avançada! Ajuste as suposições cruciais, explore vários cenários e avalie como diferentes fatores influenciam a avaliação da Wuxi Boton Technology Co., Ltd. (300031SZ) - tudo dentro de um modelo conveniente do Excel.
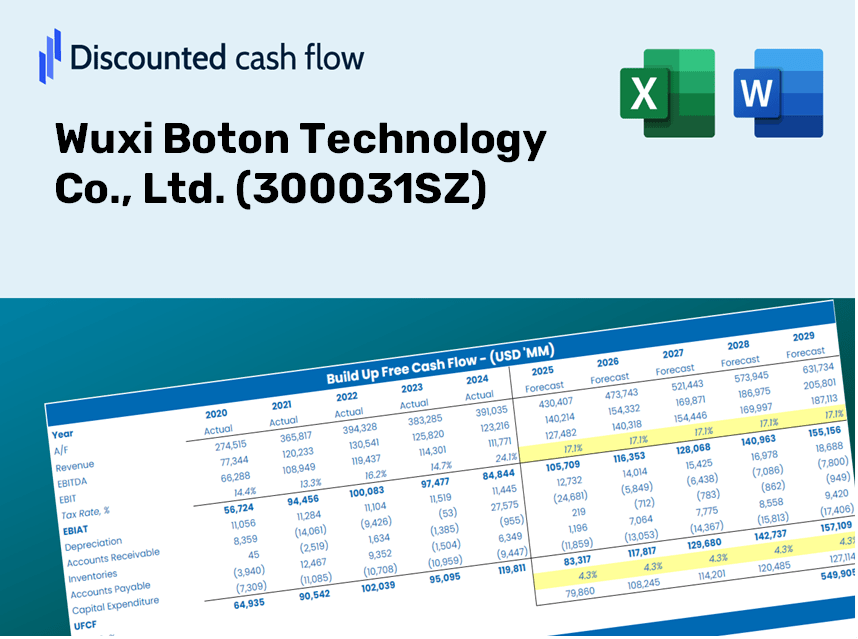
Discounted Cash Flow (DCF) - (USD MM)
| Year | AY1 2020 |
AY2 2021 |
AY3 2022 |
AY4 2023 |
AY5 2024 |
FY1 2025 |
FY2 2026 |
FY3 2027 |
FY4 2028 |
FY5 2029 |
|---|---|---|---|---|---|---|---|---|---|---|
| Revenue | 2,637.9 | 2,759.8 | 3,259.2 | 3,655.4 | 3,302.0 | 3,510.1 | 3,731.3 | 3,966.4 | 4,216.3 | 4,482.0 |
| Revenue Growth, % | 0 | 4.62 | 18.1 | 12.16 | -9.67 | 6.3 | 6.3 | 6.3 | 6.3 | 6.3 |
| EBITDA | 351.2 | 336.3 | 87.4 | 331.5 | 407.4 | 348.1 | 370.0 | 393.4 | 418.1 | 444.5 |
| EBITDA, % | 13.31 | 12.19 | 2.68 | 9.07 | 12.34 | 9.92 | 9.92 | 9.92 | 9.92 | 9.92 |
| Depreciation | 40.4 | 53.4 | 83.9 | 120.8 | 90.6 | 84.9 | 90.2 | 95.9 | 101.9 | 108.4 |
| Depreciation, % | 1.53 | 1.94 | 2.57 | 3.3 | 2.74 | 2.42 | 2.42 | 2.42 | 2.42 | 2.42 |
| EBIT | 310.8 | 282.9 | 3.5 | 210.7 | 316.7 | 263.2 | 279.8 | 297.5 | 316.2 | 336.1 |
| EBIT, % | 11.78 | 10.25 | 0.10715 | 5.76 | 9.59 | 7.5 | 7.5 | 7.5 | 7.5 | 7.5 |
| Total Cash | 722.1 | 622.2 | 898.4 | 1,156.2 | 1,221.5 | 1,025.7 | 1,090.3 | 1,159.0 | 1,232.1 | 1,309.7 |
| Total Cash, percent | .0 | .0 | .0 | .0 | .0 | .0 | .0 | .0 | .0 | .0 |
| Account Receivables | 772.7 | 873.0 | 1,062.0 | 1,153.7 | 1,059.1 | 1,103.2 | 1,172.7 | 1,246.6 | 1,325.1 | 1,408.6 |
| Account Receivables, % | 29.29 | 31.63 | 32.58 | 31.56 | 32.07 | 31.43 | 31.43 | 31.43 | 31.43 | 31.43 |
| Inventories | 261.7 | 279.4 | 329.6 | 287.0 | 377.8 | 347.1 | 369.0 | 392.3 | 417.0 | 443.3 |
| Inventories, % | 9.92 | 10.12 | 10.11 | 7.85 | 11.44 | 9.89 | 9.89 | 9.89 | 9.89 | 9.89 |
| Accounts Payable | 584.7 | 639.2 | 802.5 | 911.0 | 805.2 | 837.2 | 890.0 | 946.0 | 1,005.6 | 1,069.0 |
| Accounts Payable, % | 22.16 | 23.16 | 24.62 | 24.92 | 24.38 | 23.85 | 23.85 | 23.85 | 23.85 | 23.85 |
| Capital Expenditure | -278.8 | -279.1 | -127.0 | -276.2 | -446.7 | -320.5 | -340.7 | -362.2 | -385.0 | -409.3 |
| Capital Expenditure, % | -10.57 | -10.11 | -3.9 | -7.55 | -13.53 | -9.13 | -9.13 | -9.13 | -9.13 | -9.13 |
| Tax Rate, % | 18.63 | 18.63 | 18.63 | 18.63 | 18.63 | 18.63 | 18.63 | 18.63 | 18.63 | 18.63 |
| EBITAT | 260.7 | 256.6 | 3.3 | 198.1 | 257.7 | 233.6 | 248.3 | 264.0 | 280.6 | 298.3 |
| Depreciation | ||||||||||
| Changes in Account Receivables | ||||||||||
| Changes in Inventories | ||||||||||
| Changes in Accounts Payable | ||||||||||
| Capital Expenditure | ||||||||||
| UFCF | -427.4 | -32.5 | -115.7 | 102.1 | -200.3 | 16.5 | -40.8 | -43.4 | -46.1 | -49.0 |
| WACC, % | 6.34 | 6.36 | 6.37 | 6.37 | 6.33 | 6.35 | 6.35 | 6.35 | 6.35 | 6.35 |
| PV UFCF | ||||||||||
| SUM PV UFCF | -128.7 | |||||||||
| Long Term Growth Rate, % | 2.00 | |||||||||
| Free cash flow (T + 1) | -50 | |||||||||
| Terminal Value | -1,149 | |||||||||
| Present Terminal Value | -844 | |||||||||
| Enterprise Value | -973 | |||||||||
| Net Debt | -456 | |||||||||
| Equity Value | -517 | |||||||||
| Diluted Shares Outstanding, MM | 416 | |||||||||
| Equity Value Per Share | -1.24 |
What You Will Receive
- Accurate Wuxi Boton Financial Data: Pre-loaded with historical and projected data for detailed analysis.
- Comprehensive Editable Template: Easily adjust essential parameters such as revenue growth, WACC, and EBITDA %.
- Instant Calculations: Witness the intrinsic value of Wuxi Boton update dynamically as you make adjustments.
- Professional Valuation Tool: Tailored for investors, analysts, and consultants aiming for precise DCF outcomes.
- User-Friendly Interface: An intuitive layout with straightforward instructions suitable for all skill levels.
Key Features
- Authentic Wuxi Boton Financials: Access reliable historical data and future forecasts tailored for (300031SZ).
- Tailorable Forecast Parameters: Modify designated yellow-highlighted cells, including WACC, growth rates, and profit margins.
- Real-Time Calculations: Instant updates to DCF, Net Present Value (NPV), and cash flow evaluations.
- Interactive Dashboard: User-friendly charts and summaries to clearly illustrate your valuation outcomes.
- Designed for Everyone: An intuitive layout suitable for investors, CFOs, and consultants alike.
How It Works
- 1. Download the Template: Obtain and open the Excel file containing Wuxi Boton Technology Co., Ltd.'s preloaded data.
- 2. Modify Assumptions: Adjust essential inputs such as growth rates, WACC, and capital expenditures.
- 3. Access Immediate Results: The DCF model automatically calculates intrinsic value and NPV for [300031SZ].
- 4. Explore Different Scenarios: Assess various forecasts to evaluate different valuation possibilities.
- 5. Present with Assurance: Share expert valuation insights to enhance your decision-making process.
Why Opt for This Calculator?
- User-Friendly Interface: Tailored for both novice and experienced users.
- Customizable Inputs: Effortlessly adjust parameters to suit your analysis needs.
- Real-Time Adjustments: Witness immediate updates to Wuxi Boton Technology's valuation as you modify inputs.
- Pre-Configured Data: Comes equipped with Wuxi Boton Technology's current financial metrics for swift evaluations.
- Widely Endorsed: Utilized by investors and analysts to inform their decisions effectively.
Who Should Use This Product?
- Institutional Investors: Create comprehensive and dependable valuation models for analyzing portfolios, specifically for Wuxi Boton Technology Co., Ltd. (300031SZ).
- Corporate Strategy Teams: Explore valuation scenarios to inform strategic decisions within the company.
- Financial Consultants: Offer clients precise valuation insights regarding Wuxi Boton Technology Co., Ltd. (300031SZ).
- Students and Academics: Utilize real data to enhance learning and application of financial modeling techniques.
- Technology Analysts: Gain insights into how technology firms like Wuxi Boton Technology Co., Ltd. (300031SZ) are appraised in the marketplace.
Contents of the Template
- Pre-Filled Data: Features Wuxi Boton Technology Co., Ltd.'s historical financials and projections.
- Discounted Cash Flow Model: An editable DCF valuation model with automatic calculations included.
- Weighted Average Cost of Capital (WACC): A dedicated worksheet for calculating WACC using customized inputs.
- Key Financial Ratios: Assess Wuxi Boton Technology Co., Ltd.'s profitability, efficiency, and leverage metrics.
- Customizable Inputs: Easily adjust revenue growth, profit margins, and tax rates.
- Clear Dashboard: Visual representations and tables summarizing essential valuation results.
Disclaimer
All information, articles, and product details provided on this website are for general informational and educational purposes only. We do not claim any ownership over, nor do we intend to infringe upon, any trademarks, copyrights, logos, brand names, or other intellectual property mentioned or depicted on this site. Such intellectual property remains the property of its respective owners, and any references here are made solely for identification or informational purposes, without implying any affiliation, endorsement, or partnership.
We make no representations or warranties, express or implied, regarding the accuracy, completeness, or suitability of any content or products presented. Nothing on this website should be construed as legal, tax, investment, financial, medical, or other professional advice. In addition, no part of this site—including articles or product references—constitutes a solicitation, recommendation, endorsement, advertisement, or offer to buy or sell any securities, franchises, or other financial instruments, particularly in jurisdictions where such activity would be unlawful.
All content is of a general nature and may not address the specific circumstances of any individual or entity. It is not a substitute for professional advice or services. Any actions you take based on the information provided here are strictly at your own risk. You accept full responsibility for any decisions or outcomes arising from your use of this website and agree to release us from any liability in connection with your use of, or reliance upon, the content or products found herein.