
|
Gaona Aero Material Co., Ltd. (300034.SZ) Avaliação DCF |
Totalmente Editável: Adapte-Se Às Suas Necessidades No Excel Ou Planilhas
Design Profissional: Modelos Confiáveis E Padrão Da Indústria
Pré-Construídos Para Uso Rápido E Eficiente
Compatível com MAC/PC, totalmente desbloqueado
Não É Necessária Experiência; Fácil De Seguir
Gaona Aero Material Co., Ltd. (300034.SZ) Bundle
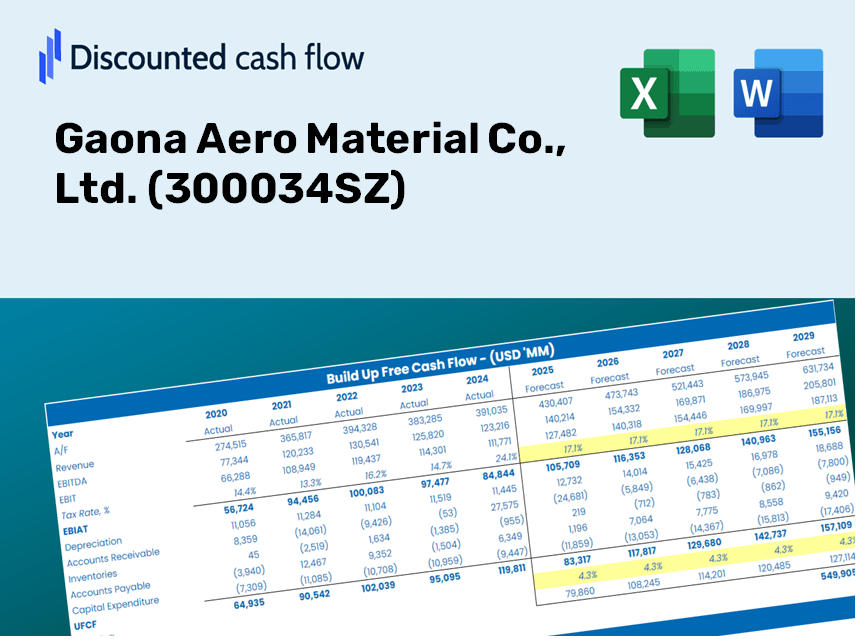
Projetado para precisão, nossa calculadora DCF (300034SZ) permite avaliar a avaliação da Gaona Aero Material Co., Ltd. usando dados financeiros do mundo real, oferecendo flexibilidade completa para modificar todos os parâmetros-chave para projeções aprimoradas.
Discounted Cash Flow (DCF) - (USD MM)
| Year | AY1 2020 |
AY2 2021 |
AY3 2022 |
AY4 2023 |
AY5 2024 |
FY1 2025 |
FY2 2026 |
FY3 2027 |
FY4 2028 |
FY5 2029 |
|---|---|---|---|---|---|---|---|---|---|---|
| Revenue | 1,585.0 | 2,002.6 | 2,879.3 | 3,408.1 | 3,523.9 | 4,333.5 | 5,329.0 | 6,553.2 | 8,058.7 | 9,910.1 |
| Revenue Growth, % | 0 | 26.35 | 43.77 | 18.37 | 3.4 | 22.97 | 22.97 | 22.97 | 22.97 | 22.97 |
| EBITDA | 336.5 | 307.2 | 502.3 | 610.2 | 576.8 | 765.2 | 941.0 | 1,157.2 | 1,423.0 | 1,749.9 |
| EBITDA, % | 21.23 | 15.34 | 17.45 | 17.9 | 16.37 | 17.66 | 17.66 | 17.66 | 17.66 | 17.66 |
| Depreciation | 66.6 | 72.9 | 105.1 | 127.3 | 119.1 | 161.3 | 198.4 | 243.9 | 300.0 | 368.9 |
| Depreciation, % | 4.2 | 3.64 | 3.65 | 3.74 | 3.38 | 3.72 | 3.72 | 3.72 | 3.72 | 3.72 |
| EBIT | 269.9 | 234.3 | 397.3 | 482.8 | 457.7 | 603.9 | 742.6 | 913.3 | 1,123.1 | 1,381.1 |
| EBIT, % | 17.03 | 11.7 | 13.8 | 14.17 | 12.99 | 13.94 | 13.94 | 13.94 | 13.94 | 13.94 |
| Total Cash | 351.7 | 558.6 | 1,043.5 | 968.9 | 676.1 | 1,160.8 | 1,427.5 | 1,755.5 | 2,158.7 | 2,654.7 |
| Total Cash, percent | .0 | .0 | .0 | .0 | .0 | .0 | .0 | .0 | .0 | .0 |
| Account Receivables | 1,263.6 | 1,701.8 | 2,219.4 | 2,334.2 | 2,475.0 | 3,297.9 | 4,055.5 | 4,987.2 | 6,132.9 | 7,541.8 |
| Account Receivables, % | 79.72 | 84.98 | 77.08 | 68.49 | 70.23 | 76.1 | 76.1 | 76.1 | 76.1 | 76.1 |
| Inventories | 591.9 | 858.0 | 1,051.6 | 1,634.6 | 1,960.3 | 1,909.3 | 2,348.0 | 2,887.4 | 3,550.7 | 4,366.4 |
| Inventories, % | 37.34 | 42.84 | 36.52 | 47.96 | 55.63 | 44.06 | 44.06 | 44.06 | 44.06 | 44.06 |
| Accounts Payable | 720.8 | 1,048.4 | 1,455.3 | 1,939.8 | 2,120.6 | 2,300.8 | 2,829.4 | 3,479.4 | 4,278.7 | 5,261.7 |
| Accounts Payable, % | 45.48 | 52.35 | 50.54 | 56.92 | 60.18 | 53.09 | 53.09 | 53.09 | 53.09 | 53.09 |
| Capital Expenditure | -226.8 | -297.1 | -210.2 | -306.1 | -263.0 | -458.4 | -563.7 | -693.2 | -852.5 | -1,048.3 |
| Capital Expenditure, % | -14.31 | -14.83 | -7.3 | -8.98 | -7.46 | -10.58 | -10.58 | -10.58 | -10.58 | -10.58 |
| Tax Rate, % | 43.02 | 43.02 | 43.02 | 43.02 | 43.02 | 43.02 | 43.02 | 43.02 | 43.02 | 43.02 |
| EBITAT | 196.2 | 199.1 | 314.6 | 345.6 | 260.8 | 441.4 | 542.8 | 667.5 | 820.9 | 1,009.5 |
| Depreciation | ||||||||||
| Changes in Account Receivables | ||||||||||
| Changes in Inventories | ||||||||||
| Changes in Accounts Payable | ||||||||||
| Capital Expenditure | ||||||||||
| UFCF | -1,098.6 | -401.7 | -94.8 | -46.5 | -168.7 | -447.4 | -490.2 | -602.8 | -741.3 | -911.6 |
| WACC, % | 4.98 | 5.01 | 5 | 4.98 | 4.95 | 4.99 | 4.99 | 4.99 | 4.99 | 4.99 |
| PV UFCF | ||||||||||
| SUM PV UFCF | -2,716.8 | |||||||||
| Long Term Growth Rate, % | 4.00 | |||||||||
| Free cash flow (T + 1) | -948 | |||||||||
| Terminal Value | -96,247 | |||||||||
| Present Terminal Value | -75,465 | |||||||||
| Enterprise Value | -78,182 | |||||||||
| Net Debt | 30 | |||||||||
| Equity Value | -78,213 | |||||||||
| Diluted Shares Outstanding, MM | 775 | |||||||||
| Equity Value Per Share | -100.91 |
What You Will Receive
- Authentic Gaona Data: Comprehensive financials – including revenue and EBIT – derived from actual and forecasted figures.
- Complete Customization: Modify all key parameters (yellow cells) such as WACC, growth percentage, and tax rates.
- Instant Valuation Updates: Automatic recalibrations to assess the effects of changes on Gaona Aero Material Co., Ltd.'s fair value.
- Flexible Excel Template: Designed for easy adjustments, scenario analysis, and thorough projections.
- Efficient and Accurate: Eliminate the need to construct models from the ground up while ensuring precision and adaptability.
Key Features of Gaona Aero Material Co., Ltd. (300034SZ)
- Comprehensive Financial Data: Access precise pre-loaded historical figures along with future forecasts.
- Adjustable Forecast Parameters: Modify the highlighted cells for metrics like WACC, growth rates, and profit margins.
- Real-Time Calculations: Automatic updates for DCF, Net Present Value (NPV), and cash flow assessments.
- User-Friendly Dashboard: Clear and informative charts and summaries to help you interpret your valuation findings.
- Suitable for All Users: A straightforward and intuitive layout designed for investors, CFOs, and consultants alike.
How It Operates
- 1. Access the Template: Download and open the Excel file featuring Gaona Aero Material Co., Ltd.'s preloaded data.
- 2. Adjust Assumptions: Modify key variables such as growth rates, WACC, and capital expenditures.
- 3. View Results Real-Time: The DCF model automatically calculates the intrinsic value and NPV.
- 4. Explore Scenarios: Analyze different valuation outcomes by comparing various forecasts.
- 5. Present with Assurance: Deliver professional valuation insights to back your decisions.
Why Choose Gaona Aero Material Co., Ltd. (300034SZ) Calculator?
- Time-Saving: Skip the hassle of building a DCF model from the ground up – it’s readily available.
- Enhanced Accuracy: Dependable financial data and formulas minimize valuation errors.
- Completely Customizable: Adjust the model to suit your specific assumptions and forecasts.
- User-Friendly: Intuitive charts and outputs facilitate easy analysis of results.
- Endorsed by Professionals: Crafted for experts who prioritize accuracy and functionality.
Who Can Benefit from Our Product?
- Investors: Accurately assess the fair value of Gaona Aero Material Co., Ltd. (300034SZ) before making investment choices.
- CFOs: Utilize a top-tier DCF model for comprehensive financial reporting and analysis.
- Consultants: Efficiently customize the template for valuation reports tailored to clients.
- Entrepreneurs: Acquire insights into financial modeling strategies employed by leading aerospace firms.
- Educators: Implement it as a teaching resource to illustrate various valuation techniques.
Contents of the Template
- In-Depth DCF Model: A customizable template featuring extensive valuation calculations.
- Real-Time Data: Gaona Aero Material Co., Ltd.'s ([300034SZ]) historical and projected financial data preloaded for your analysis.
- Adjustable Variables: Modify WACC, growth rates, and tax assumptions to explore various scenarios.
- Comprehensive Financial Statements: Detailed annual and quarterly insights for thorough analysis.
- Essential Ratios: Integrated analysis for profitability, efficiency, and leverage metrics.
- Interactive Dashboard with Visual Outputs: Graphs and tables presenting clear, actionable insights.
Disclaimer
All information, articles, and product details provided on this website are for general informational and educational purposes only. We do not claim any ownership over, nor do we intend to infringe upon, any trademarks, copyrights, logos, brand names, or other intellectual property mentioned or depicted on this site. Such intellectual property remains the property of its respective owners, and any references here are made solely for identification or informational purposes, without implying any affiliation, endorsement, or partnership.
We make no representations or warranties, express or implied, regarding the accuracy, completeness, or suitability of any content or products presented. Nothing on this website should be construed as legal, tax, investment, financial, medical, or other professional advice. In addition, no part of this site—including articles or product references—constitutes a solicitation, recommendation, endorsement, advertisement, or offer to buy or sell any securities, franchises, or other financial instruments, particularly in jurisdictions where such activity would be unlawful.
All content is of a general nature and may not address the specific circumstances of any individual or entity. It is not a substitute for professional advice or services. Any actions you take based on the information provided here are strictly at your own risk. You accept full responsibility for any decisions or outcomes arising from your use of this website and agree to release us from any liability in connection with your use of, or reliance upon, the content or products found herein.