
|
Tech Semiconductors Co., Ltd. (300046.sz) Avaliação DCF |
Totalmente Editável: Adapte-Se Às Suas Necessidades No Excel Ou Planilhas
Design Profissional: Modelos Confiáveis E Padrão Da Indústria
Pré-Construídos Para Uso Rápido E Eficiente
Compatível com MAC/PC, totalmente desbloqueado
Não É Necessária Experiência; Fácil De Seguir
Tech Semiconductors Co., Ltd. (300046.SZ) Bundle
Descubra o verdadeiro valor de Tech Semiconductors Co., Ltd. (300046SZ) com nossa calculadora DCF avançada! Ajuste as suposições críticas, explore vários cenários e examine como as mudanças afetam a avaliação de Tech Semiconductors Co., Ltd. (300046SZ) - tudo dentro de um único modelo do Excel.
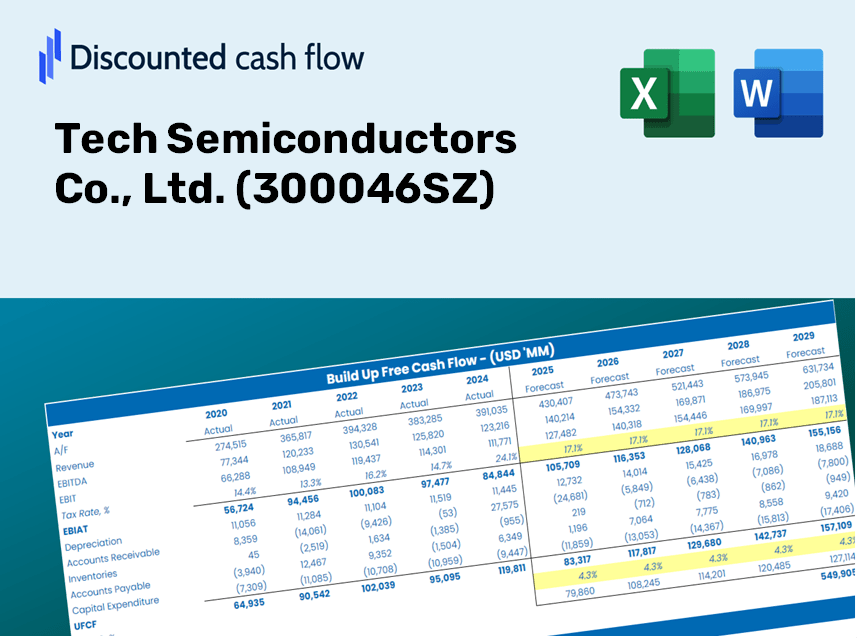
Discounted Cash Flow (DCF) - (USD MM)
| Year | AY1 2020 |
AY2 2021 |
AY3 2022 |
AY4 2023 |
AY5 2024 |
FY1 2025 |
FY2 2026 |
FY3 2027 |
FY4 2028 |
FY5 2029 |
|---|---|---|---|---|---|---|---|---|---|---|
| Revenue | 388.2 | 329.0 | 352.2 | 319.7 | 354.1 | 348.2 | 342.4 | 336.7 | 331.1 | 325.6 |
| Revenue Growth, % | 0 | -15.26 | 7.05 | -9.22 | 10.76 | -1.67 | -1.67 | -1.67 | -1.67 | -1.67 |
| EBITDA | 51.1 | 64.4 | 31.4 | 49.6 | 38.5 | 47.4 | 46.6 | 45.8 | 45.1 | 44.3 |
| EBITDA, % | 13.15 | 19.59 | 8.92 | 15.51 | 10.87 | 13.61 | 13.61 | 13.61 | 13.61 | 13.61 |
| Depreciation | 17.4 | 14.8 | 11.9 | 11.4 | 13.3 | 13.7 | 13.5 | 13.2 | 13.0 | 12.8 |
| Depreciation, % | 4.47 | 4.49 | 3.38 | 3.58 | 3.76 | 3.93 | 3.93 | 3.93 | 3.93 | 3.93 |
| EBIT | 33.7 | 49.7 | 19.5 | 38.2 | 25.2 | 33.7 | 33.1 | 32.6 | 32.0 | 31.5 |
| EBIT, % | 8.68 | 15.1 | 5.54 | 11.94 | 7.12 | 9.68 | 9.68 | 9.68 | 9.68 | 9.68 |
| Total Cash | 324.1 | 717.3 | 748.8 | 745.9 | 790.8 | 336.7 | 331.1 | 325.6 | 320.2 | 314.8 |
| Total Cash, percent | .0 | .0 | .0 | .0 | .0 | .0 | .0 | .0 | .0 | .0 |
| Account Receivables | 115.5 | 131.1 | 133.7 | 147.9 | 149.2 | 136.5 | 134.2 | 132.0 | 129.8 | 127.6 |
| Account Receivables, % | 29.76 | 39.84 | 37.97 | 46.26 | 42.12 | 39.19 | 39.19 | 39.19 | 39.19 | 39.19 |
| Inventories | 134.0 | 101.3 | 114.4 | 88.4 | 100.8 | 107.2 | 105.4 | 103.7 | 101.9 | 100.2 |
| Inventories, % | 34.52 | 30.79 | 32.48 | 27.66 | 28.46 | 30.78 | 30.78 | 30.78 | 30.78 | 30.78 |
| Accounts Payable | 69.8 | 37.3 | 44.2 | 61.9 | 66.9 | 55.8 | 54.9 | 54.0 | 53.1 | 52.2 |
| Accounts Payable, % | 17.97 | 11.32 | 12.56 | 19.37 | 18.9 | 16.02 | 16.02 | 16.02 | 16.02 | 16.02 |
| Capital Expenditure | -3.7 | -12.3 | -10.0 | -37.4 | -15.7 | -16.5 | -16.2 | -15.9 | -15.7 | -15.4 |
| Capital Expenditure, % | -0.9481 | -3.75 | -2.84 | -11.68 | -4.42 | -4.73 | -4.73 | -4.73 | -4.73 | -4.73 |
| Tax Rate, % | -0.47875 | -0.47875 | -0.47875 | -0.47875 | -0.47875 | -0.47875 | -0.47875 | -0.47875 | -0.47875 | -0.47875 |
| EBITAT | 34.7 | 44.0 | 19.6 | 31.2 | 25.3 | 31.7 | 31.2 | 30.6 | 30.1 | 29.6 |
| Depreciation | ||||||||||
| Changes in Account Receivables | ||||||||||
| Changes in Inventories | ||||||||||
| Changes in Accounts Payable | ||||||||||
| Capital Expenditure | ||||||||||
| UFCF | -131.4 | 31.1 | 12.8 | 34.7 | 14.4 | 24.0 | 31.6 | 31.0 | 30.5 | 30.0 |
| WACC, % | 4.82 | 4.82 | 4.82 | 4.82 | 4.82 | 4.82 | 4.82 | 4.82 | 4.82 | 4.82 |
| PV UFCF | ||||||||||
| SUM PV UFCF | 127.6 | |||||||||
| Long Term Growth Rate, % | 4.00 | |||||||||
| Free cash flow (T + 1) | 31 | |||||||||
| Terminal Value | 3,809 | |||||||||
| Present Terminal Value | 3,010 | |||||||||
| Enterprise Value | 3,138 | |||||||||
| Net Debt | -547 | |||||||||
| Equity Value | 3,684 | |||||||||
| Diluted Shares Outstanding, MM | 237 | |||||||||
| Equity Value Per Share | 15.58 |
What You Will Receive
- Pre-Filled Financial Model: Tech Semiconductors Co., Ltd. (300046SZ) data allows for accurate DCF valuation.
- Comprehensive Forecast Control: Modify revenue growth, profit margins, WACC, and other crucial factors.
- Real-Time Calculations: Automated updates provide immediate feedback on your adjustments.
- Professional-Grade Template: A polished Excel file crafted for expert-level valuation.
- Flexible and Reusable: Designed for adaptability, enabling repeated usage for in-depth forecasts.
Key Features
- Comprehensive DCF Calculator: Features detailed unlevered and levered DCF valuation models tailored for Tech Semiconductors Co., Ltd. (300046SZ).
- WACC Calculator: Ready-to-use Weighted Average Cost of Capital sheet with options for customizable parameters.
- Customizable Forecast Assumptions: Adjust growth rates, capital expenditures, and discount rates as needed.
- Integrated Financial Ratios: Evaluate profitability, leverage, and efficiency ratios specific to Tech Semiconductors Co., Ltd. (300046SZ).
- Interactive Dashboard and Charts: Visual representations that summarize essential valuation metrics for straightforward analysis.
How It Functions
- Step 1: Download the Excel file for Tech Semiconductors Co., Ltd. (300046SZ).
- Step 2: Examine the pre-filled financial data and forecasts for Tech Semiconductors.
- Step 3: Adjust key inputs such as revenue growth, WACC, and tax rates (highlighted cells).
- Step 4: Observe the DCF model update in real-time as you modify your assumptions.
- Step 5: Evaluate the outcomes and utilize the findings for your investment decisions.
Why Opt for the Tech Semiconductors Co., Ltd. (300046SZ) Calculator?
- Save Time: Skip the hassle of building a DCF model from scratch – it's immediately available for use.
- Enhance Accuracy: Dependable financial data and formulas minimize errors in your valuation process.
- Fully Customizable: Adjust the model to suit your specific assumptions and forecasts.
- Simple to Analyze: Intuitive charts and outputs ensure results are easy to understand.
- Expert Approved: Crafted for professionals who prioritize precision and user-friendliness.
Who Can Benefit from This Product?
- Engineering Students: Develop a deep understanding of semiconductor technology and its real-world applications.
- Researchers: Integrate industry-standard models into your studies or projects related to semiconductor advancements.
- Investors: Validate your investment strategies and evaluate the performance metrics of Tech Semiconductors Co., Ltd. (300046SZ).
- Market Analysts: Enhance your analysis with a ready-made, customizable model tailored for semiconductor valuation.
- Entrepreneurs: Discover how leading semiconductor companies like Tech Semiconductors Co., Ltd. (300046SZ) are assessed in the market.
Contents of the Template
- Preloaded TSCL Data: Historical and projected financial information, including revenue, EBIT, and capital expenditures.
- DCF and WACC Models: Professional-grade spreadsheets for determining intrinsic value and Weighted Average Cost of Capital.
- Editable Inputs: Yellow-highlighted cells to modify revenue growth, tax rates, and discount rates.
- Financial Statements: Detailed annual and quarterly statements for in-depth analysis.
- Key Ratios: Ratios for profitability, leverage, and efficiency to assess performance.
- Dashboard and Charts: Visual representations of valuation results and underlying assumptions.
Disclaimer
All information, articles, and product details provided on this website are for general informational and educational purposes only. We do not claim any ownership over, nor do we intend to infringe upon, any trademarks, copyrights, logos, brand names, or other intellectual property mentioned or depicted on this site. Such intellectual property remains the property of its respective owners, and any references here are made solely for identification or informational purposes, without implying any affiliation, endorsement, or partnership.
We make no representations or warranties, express or implied, regarding the accuracy, completeness, or suitability of any content or products presented. Nothing on this website should be construed as legal, tax, investment, financial, medical, or other professional advice. In addition, no part of this site—including articles or product references—constitutes a solicitation, recommendation, endorsement, advertisement, or offer to buy or sell any securities, franchises, or other financial instruments, particularly in jurisdictions where such activity would be unlawful.
All content is of a general nature and may not address the specific circumstances of any individual or entity. It is not a substitute for professional advice or services. Any actions you take based on the information provided here are strictly at your own risk. You accept full responsibility for any decisions or outcomes arising from your use of this website and agree to release us from any liability in connection with your use of, or reliance upon, the content or products found herein.