
|
Zhejiang Narada Power Source Co., Ltd. (300068.sz) Avaliação DCF |
Totalmente Editável: Adapte-Se Às Suas Necessidades No Excel Ou Planilhas
Design Profissional: Modelos Confiáveis E Padrão Da Indústria
Pré-Construídos Para Uso Rápido E Eficiente
Compatível com MAC/PC, totalmente desbloqueado
Não É Necessária Experiência; Fácil De Seguir
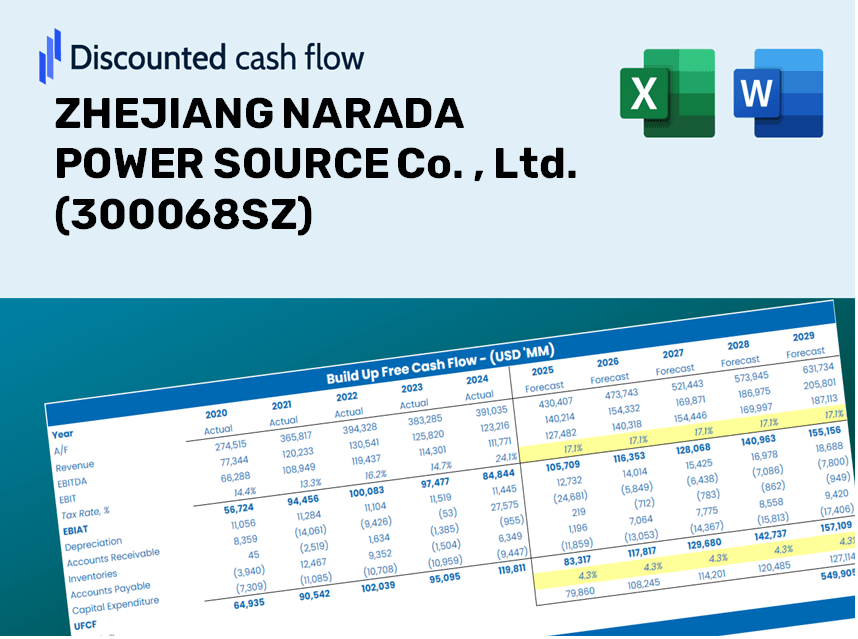
ZHEJIANG NARADA POWER SOURCE Co. , Ltd. (300068.SZ) Bundle
Otimize seu tempo e melhore a precisão com a calculadora DCF [300068SZ]! Utilizando dados reais da Zhejiang Narada Power Source Co., Ltd. e suposições personalizáveis, essa ferramenta o capacita a prever, analisar e avaliar [Empresa] como um investidor experiente.
Discounted Cash Flow (DCF) - (USD MM)
| Year | AY1 2020 |
AY2 2021 |
AY3 2022 |
AY4 2023 |
AY5 2024 |
FY1 2025 |
FY2 2026 |
FY3 2027 |
FY4 2028 |
FY5 2029 |
|---|---|---|---|---|---|---|---|---|---|---|
| Revenue | 10,259.8 | 11,847.6 | 11,748.6 | 14,665.6 | 7,983.8 | 7,862.2 | 7,742.4 | 7,624.5 | 7,508.4 | 7,394.0 |
| Revenue Growth, % | 0 | 15.48 | -0.83536 | 24.83 | -45.56 | -1.52 | -1.52 | -1.52 | -1.52 | -1.52 |
| EBITDA | 151.2 | -707.8 | 622.1 | 778.0 | -775.4 | -56.8 | -56.0 | -55.1 | -54.3 | -53.4 |
| EBITDA, % | 1.47 | -5.97 | 5.3 | 5.3 | -9.71 | -0.72274 | -0.72274 | -0.72274 | -0.72274 | -0.72274 |
| Depreciation | 394.4 | 426.0 | 428.1 | 450.6 | 528.8 | 326.7 | 321.8 | 316.9 | 312.0 | 307.3 |
| Depreciation, % | 3.84 | 3.6 | 3.64 | 3.07 | 6.62 | 4.16 | 4.16 | 4.16 | 4.16 | 4.16 |
| EBIT | -243.2 | -1,133.8 | 194.0 | 327.4 | -1,304.2 | -383.6 | -377.7 | -372.0 | -366.3 | -360.7 |
| EBIT, % | -2.37 | -9.57 | 1.65 | 2.23 | -16.34 | -4.88 | -4.88 | -4.88 | -4.88 | -4.88 |
| Total Cash | 1,080.2 | 911.2 | 1,301.0 | 1,717.9 | 2,210.3 | 1,080.1 | 1,063.7 | 1,047.5 | 1,031.5 | 1,015.8 |
| Total Cash, percent | .0 | .0 | .0 | .0 | .0 | .0 | .0 | .0 | .0 | .0 |
| Account Receivables | 2,475.2 | 1,507.1 | 2,324.2 | 3,398.4 | 3,161.7 | 1,877.5 | 1,848.9 | 1,820.8 | 1,793.0 | 1,765.7 |
| Account Receivables, % | 24.13 | 12.72 | 19.78 | 23.17 | 39.6 | 23.88 | 23.88 | 23.88 | 23.88 | 23.88 |
| Inventories | 3,603.8 | 3,179.9 | 5,261.2 | 5,129.4 | 4,229.2 | 3,061.4 | 3,014.8 | 2,968.9 | 2,923.7 | 2,879.2 |
| Inventories, % | 35.13 | 26.84 | 44.78 | 34.98 | 52.97 | 38.94 | 38.94 | 38.94 | 38.94 | 38.94 |
| Accounts Payable | 2,125.5 | 2,175.1 | 3,629.1 | 4,312.2 | 3,754.5 | 2,302.0 | 2,266.9 | 2,232.4 | 2,198.4 | 2,164.9 |
| Accounts Payable, % | 20.72 | 18.36 | 30.89 | 29.4 | 47.03 | 29.28 | 29.28 | 29.28 | 29.28 | 29.28 |
| Capital Expenditure | -944.7 | -917.3 | -844.5 | -1,127.3 | -1,408.4 | -777.8 | -766.0 | -754.3 | -742.8 | -731.5 |
| Capital Expenditure, % | -9.21 | -7.74 | -7.19 | -7.69 | -17.64 | -9.89 | -9.89 | -9.89 | -9.89 | -9.89 |
| Tax Rate, % | 6.4 | 6.4 | 6.4 | 6.4 | 6.4 | 6.4 | 6.4 | 6.4 | 6.4 | 6.4 |
| EBITAT | -167.5 | -926.3 | 259.6 | -216.3 | -1,220.7 | -264.0 | -260.0 | -256.0 | -252.1 | -248.3 |
| Depreciation | ||||||||||
| Changes in Account Receivables | ||||||||||
| Changes in Inventories | ||||||||||
| Changes in Accounts Payable | ||||||||||
| Capital Expenditure | ||||||||||
| UFCF | -4,671.3 | 24.0 | -1,601.1 | -1,152.4 | -1,521.0 | 284.3 | -664.0 | -653.9 | -644.0 | -634.2 |
| WACC, % | 5.51 | 5.71 | 5.99 | 4.43 | 5.89 | 5.5 | 5.5 | 5.5 | 5.5 | 5.5 |
| PV UFCF | ||||||||||
| SUM PV UFCF | -1,888.7 | |||||||||
| Long Term Growth Rate, % | 3.50 | |||||||||
| Free cash flow (T + 1) | -656 | |||||||||
| Terminal Value | -32,736 | |||||||||
| Present Terminal Value | -25,041 | |||||||||
| Enterprise Value | -26,930 | |||||||||
| Net Debt | 5,344 | |||||||||
| Equity Value | -32,274 | |||||||||
| Diluted Shares Outstanding, MM | 860 | |||||||||
| Equity Value Per Share | -37.52 |
What You Will Receive
- Flexible Forecast Inputs: Easily adjust parameters (growth %, profit margins, WACC) to model various scenarios.
- Comprehensive Data: ZHEJIANG NARADA POWER SOURCE Co., Ltd.'s financial information pre-loaded to accelerate your analysis.
- Automated DCF Outputs: The template computes Net Present Value (NPV) and intrinsic value automatically.
- Customizable and Professional Design: A refined Excel model tailored to meet your valuation requirements.
- Designed for Analysts and Investors: Perfect for evaluating projections, verifying strategies, and maximizing efficiency.
Core Attributes
- Authentic Financial Data: Gain access to precise historical figures and future forecasts for ZHEJIANG NARADA POWER SOURCE Co., Ltd. (300068SZ).
- Adjustable Projection Parameters: Modify the highlighted cells for WACC, growth rates, and profit margins as needed.
- Real-Time Calculations: Automatic updates for DCF, Net Present Value (NPV), and cash flow assessments.
- Interactive Dashboard: User-friendly charts and overviews to help you visualize valuation outcomes.
- Designed for Everyone: A straightforward, user-friendly layout catering to investors, CFOs, and consultants alike.
How It Works
- Step 1: Download the prebuilt Excel template featuring data for ZHEJIANG NARADA POWER SOURCE Co., Ltd. (300068SZ).
- Step 2: Navigate through the pre-filled sheets to familiarize yourself with the key metrics.
- Step 3: Adjust forecasts and assumptions in the editable yellow cells (WACC, growth, margins).
- Step 4: Instantly see the recalculated results, including the intrinsic value of ZHEJIANG NARADA POWER SOURCE Co., Ltd. (300068SZ).
- Step 5: Use the outputs to make informed investment decisions or create comprehensive reports.
Why Choose Narada Power Source Calculator?
- Save Time: Skip the hassle of building a DCF model from the ground up – it's fully prepared for your use.
- Enhance Precision: Dependable financial data and formulas help minimize errors in your valuation process.
- Completely Customizable: Adjust the model to align with your specific assumptions and forecasts.
- User-Friendly Interface: Intuitive charts and outputs simplify the analysis of results.
- Endorsed by Professionals: Crafted for experts who prioritize accuracy and ease of use.
Who Can Benefit from ZHEJIANG NARADA POWER SOURCE Co., Ltd. (300068SZ)?
- Investors: Make informed investment choices with insights from a trusted industry leader.
- Financial Analysts: Streamline your analysis with comprehensive data and reports tailored for your needs.
- Consultants: Easily customize our resources for impactful presentations or client communications.
- Energy Sector Enthusiasts: Enhance your knowledge of power solutions and market trends with practical examples.
- Educators and Students: Utilize our materials as a valuable resource in energy and finance education.
Contents of the Template
- Comprehensive DCF Model: An adjustable template featuring in-depth valuation calculations.
- Real-World Data: Preloaded historical and projected financials for ZHEJIANG NARADA POWER SOURCE Co., Ltd. (300068SZ) for thorough analysis.
- Customizable Parameters: Modify WACC, growth rates, and tax assumptions to explore various scenarios.
- Financial Statements: Complete annual and quarterly breakdowns for enhanced insights.
- Key Ratios: Integrated analysis for profitability, efficiency, and leverage metrics.
- Dashboard with Visual Outputs: Includes charts and tables for straightforward, actionable results.
Disclaimer
All information, articles, and product details provided on this website are for general informational and educational purposes only. We do not claim any ownership over, nor do we intend to infringe upon, any trademarks, copyrights, logos, brand names, or other intellectual property mentioned or depicted on this site. Such intellectual property remains the property of its respective owners, and any references here are made solely for identification or informational purposes, without implying any affiliation, endorsement, or partnership.
We make no representations or warranties, express or implied, regarding the accuracy, completeness, or suitability of any content or products presented. Nothing on this website should be construed as legal, tax, investment, financial, medical, or other professional advice. In addition, no part of this site—including articles or product references—constitutes a solicitation, recommendation, endorsement, advertisement, or offer to buy or sell any securities, franchises, or other financial instruments, particularly in jurisdictions where such activity would be unlawful.
All content is of a general nature and may not address the specific circumstances of any individual or entity. It is not a substitute for professional advice or services. Any actions you take based on the information provided here are strictly at your own risk. You accept full responsibility for any decisions or outcomes arising from your use of this website and agree to release us from any liability in connection with your use of, or reliance upon, the content or products found herein.