
|
Wuhu Token Sciences Co., Ltd. (300088.sz) Avaliação DCF |
Totalmente Editável: Adapte-Se Às Suas Necessidades No Excel Ou Planilhas
Design Profissional: Modelos Confiáveis E Padrão Da Indústria
Pré-Construídos Para Uso Rápido E Eficiente
Compatível com MAC/PC, totalmente desbloqueado
Não É Necessária Experiência; Fácil De Seguir
Wuhu Token Sciences Co., Ltd. (300088.SZ) Bundle
Descubra o verdadeiro potencial da Wuhu Token Sciences Co., Ltd. (300088SZ) com nossa calculadora DCF avançada! Ajuste as suposições essenciais, explore vários cenários e avalie como as modificações influenciam a avaliação da Wuhu Token Sciences Co., Ltd. (300088SZ) - tudo dentro de um modelo abrangente do Excel.
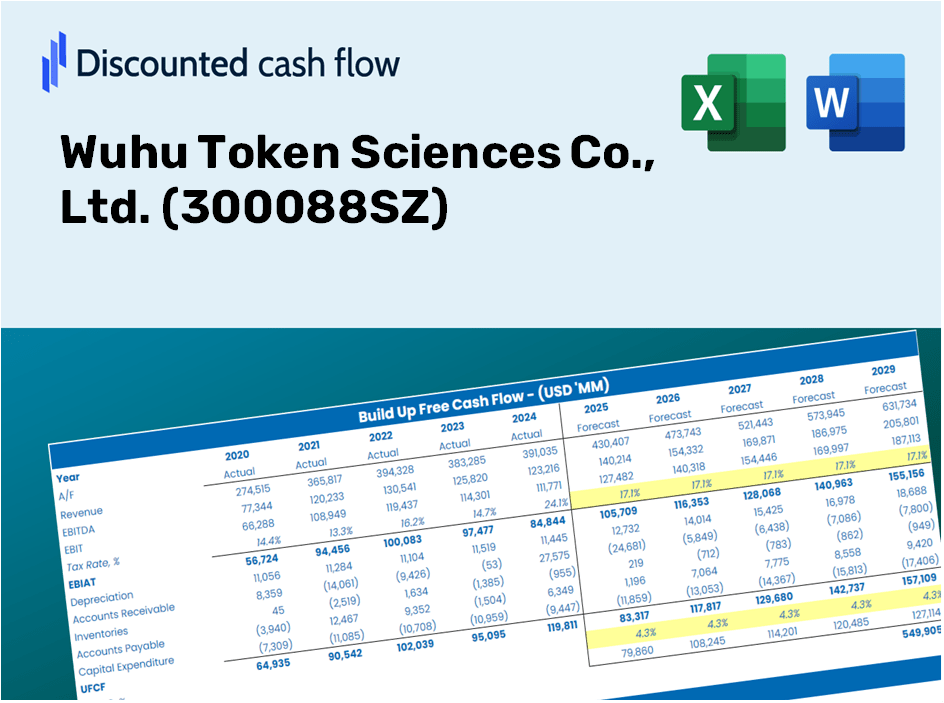
Discounted Cash Flow (DCF) - (USD MM)
| Year | AY1 2020 |
AY2 2021 |
AY3 2022 |
AY4 2023 |
AY5 2024 |
FY1 2025 |
FY2 2026 |
FY3 2027 |
FY4 2028 |
FY5 2029 |
|---|---|---|---|---|---|---|---|---|---|---|
| Revenue | 6,844.0 | 7,018.4 | 6,987.3 | 8,888.7 | 11,057.8 | 12,542.8 | 14,227.4 | 16,138.1 | 18,305.5 | 20,764.0 |
| Revenue Growth, % | 0 | 2.55 | -0.444 | 27.21 | 24.4 | 13.43 | 13.43 | 13.43 | 13.43 | 13.43 |
| EBITDA | 1,536.0 | 1,694.1 | 1,431.0 | 1,180.1 | 1,166.5 | 2,280.0 | 2,586.2 | 2,933.5 | 3,327.5 | 3,774.4 |
| EBITDA, % | 22.44 | 24.14 | 20.48 | 13.28 | 10.55 | 18.18 | 18.18 | 18.18 | 18.18 | 18.18 |
| Depreciation | 557.8 | 673.4 | 777.1 | 818.7 | 732.6 | 1,121.4 | 1,272.0 | 1,442.8 | 1,636.6 | 1,856.4 |
| Depreciation, % | 8.15 | 9.59 | 11.12 | 9.21 | 6.63 | 8.94 | 8.94 | 8.94 | 8.94 | 8.94 |
| EBIT | 978.2 | 1,020.7 | 653.9 | 361.4 | 433.9 | 1,158.6 | 1,314.2 | 1,490.7 | 1,690.9 | 1,918.0 |
| EBIT, % | 14.29 | 14.54 | 9.36 | 4.07 | 3.92 | 9.24 | 9.24 | 9.24 | 9.24 | 9.24 |
| Total Cash | 1,743.7 | 1,406.2 | 1,728.5 | 1,556.4 | 1,842.7 | 2,619.6 | 2,971.4 | 3,370.5 | 3,823.1 | 4,336.6 |
| Total Cash, percent | .0 | .0 | .0 | .0 | .0 | .0 | .0 | .0 | .0 | .0 |
| Account Receivables | 1,663.2 | 2,142.2 | 2,122.1 | 2,552.4 | 3,929.5 | 3,749.0 | 4,252.5 | 4,823.6 | 5,471.4 | 6,206.2 |
| Account Receivables, % | 24.3 | 30.52 | 30.37 | 28.71 | 35.54 | 29.89 | 29.89 | 29.89 | 29.89 | 29.89 |
| Inventories | 409.6 | 582.3 | 853.0 | 1,198.8 | 1,312.2 | 1,300.5 | 1,475.2 | 1,673.3 | 1,898.0 | 2,152.9 |
| Inventories, % | 5.98 | 8.3 | 12.21 | 13.49 | 11.87 | 10.37 | 10.37 | 10.37 | 10.37 | 10.37 |
| Accounts Payable | 1,200.9 | 1,682.8 | 2,283.0 | 2,593.6 | 2,999.9 | 3,273.9 | 3,713.5 | 4,212.3 | 4,778.0 | 5,419.7 |
| Accounts Payable, % | 17.55 | 23.98 | 32.67 | 29.18 | 27.13 | 26.1 | 26.1 | 26.1 | 26.1 | 26.1 |
| Capital Expenditure | -696.3 | -1,330.7 | -943.9 | -1,206.0 | -742.7 | -1,578.6 | -1,790.6 | -2,031.1 | -2,303.9 | -2,613.3 |
| Capital Expenditure, % | -10.17 | -18.96 | -13.51 | -13.57 | -6.72 | -12.59 | -12.59 | -12.59 | -12.59 | -12.59 |
| Tax Rate, % | 1.03 | 1.03 | 1.03 | 1.03 | 1.03 | 1.03 | 1.03 | 1.03 | 1.03 | 1.03 |
| EBITAT | 820.6 | 870.9 | 609.2 | 275.9 | 429.4 | 1,014.2 | 1,150.4 | 1,304.9 | 1,480.2 | 1,679.0 |
| Depreciation | ||||||||||
| Changes in Account Receivables | ||||||||||
| Changes in Inventories | ||||||||||
| Changes in Accounts Payable | ||||||||||
| Capital Expenditure | ||||||||||
| UFCF | -189.8 | 43.8 | 792.0 | -576.9 | -664.9 | 1,023.2 | 393.3 | 446.2 | 506.1 | 574.0 |
| WACC, % | 8.04 | 8.05 | 8.09 | 7.99 | 8.12 | 8.06 | 8.06 | 8.06 | 8.06 | 8.06 |
| PV UFCF | ||||||||||
| SUM PV UFCF | 2,398.2 | |||||||||
| Long Term Growth Rate, % | 2.00 | |||||||||
| Free cash flow (T + 1) | 586 | |||||||||
| Terminal Value | 9,665 | |||||||||
| Present Terminal Value | 6,560 | |||||||||
| Enterprise Value | 8,958 | |||||||||
| Net Debt | 1,485 | |||||||||
| Equity Value | 7,474 | |||||||||
| Diluted Shares Outstanding, MM | 2,379 | |||||||||
| Equity Value Per Share | 3.14 |
What You Will Receive
- Comprehensive [Symbol] Financials: Access both historical and forecasted data for precise assessments.
- Customizable Inputs: Adjust parameters such as WACC, tax rates, revenue growth, and capital expenditures.
- Dynamic Calculations: Get real-time calculations for intrinsic value and NPV.
- Scenario Simulation: Explore various scenarios to analyze Wuhu Token Sciences Co., Ltd.'s future outlook.
- User-Friendly Interface: Designed for experts but easy enough for newcomers.
Key Features
- Authentic Wuhu Token Data: Comes pre-loaded with Wuhu Token Sciences Co., Ltd.'s historical performance and future forecasts.
- Customizable Parameters: Tailor your assumptions on revenue growth, profit margins, discount rates, tax obligations, and capital investments.
- Adaptive Valuation Model: Automatically recalculates Net Present Value (NPV) and intrinsic value in response to your adjustments.
- Scenario Analysis: Build multiple forecasting scenarios to explore a variety of valuation possibilities.
- Intuitive User Experience: Designed for ease of use, suitable for both professionals and newcomers.
How It Works
- 1. Access the Template: Download and open the Excel file containing Wuhu Token Sciences Co., Ltd. (300088SZ)’s preloaded data.
- 2. Adjust Key Assumptions: Modify crucial inputs such as growth rates, WACC, and capital expenditures to suit your analysis.
- 3. View Results in Real-Time: The DCF model automatically computes intrinsic value and NPV based on your inputs.
- 4. Explore Different Scenarios: Evaluate various forecasts to assess a range of valuation possibilities.
- 5. Present with Assurance: Deliver professional valuation insights to reinforce your strategic decisions.
Why Choose Wuhu Token Sciences Co., Ltd. (300088SZ)?
- User-Friendly Interface: Perfectly crafted for both novices and seasoned professionals.
- Customizable Parameters: Easily adjust inputs to fit your specific analysis needs.
- Real-Time Feedback: Instantly view updates to Wuhu Token's valuation as you modify the inputs.
- Pre-Configured Data: Comes preloaded with Wuhu Token's latest financial information for swift evaluations.
- Preferred by Experts: Trusted by investors and analysts for making well-informed choices.
Who Can Benefit from Wuhu Token Sciences Co., Ltd. (300088SZ)?
- Investors: Make informed investment choices by accurately assessing the fair value of Wuhu Token Sciences (300088SZ).
- CFOs: Utilize a high-quality DCF model for comprehensive financial analysis and reporting.
- Consultants: Effortlessly customize the valuation template for client reports related to Wuhu Token Sciences (300088SZ).
- Entrepreneurs: Discover financial modeling techniques employed by leading companies in the industry.
- Educators: Employ this resource as a teaching aid to illustrate various valuation methods.
Contents of the Template
- Pre-Filled DCF Model: Wuhu Token Sciences Co., Ltd.’s financial data preloaded for immediate application.
- WACC Calculator: Comprehensive calculations for Weighted Average Cost of Capital.
- Financial Ratios: Assess Wuhu Token Sciences’ profitability, leverage, and efficiency.
- Editable Inputs: Modify assumptions such as growth rates, margins, and CAPEX to suit your scenarios.
- Financial Statements: Annual and quarterly reports to facilitate in-depth analysis.
- Interactive Dashboard: Effortlessly visualize key valuation metrics and outcomes.
Disclaimer
All information, articles, and product details provided on this website are for general informational and educational purposes only. We do not claim any ownership over, nor do we intend to infringe upon, any trademarks, copyrights, logos, brand names, or other intellectual property mentioned or depicted on this site. Such intellectual property remains the property of its respective owners, and any references here are made solely for identification or informational purposes, without implying any affiliation, endorsement, or partnership.
We make no representations or warranties, express or implied, regarding the accuracy, completeness, or suitability of any content or products presented. Nothing on this website should be construed as legal, tax, investment, financial, medical, or other professional advice. In addition, no part of this site—including articles or product references—constitutes a solicitation, recommendation, endorsement, advertisement, or offer to buy or sell any securities, franchises, or other financial instruments, particularly in jurisdictions where such activity would be unlawful.
All content is of a general nature and may not address the specific circumstances of any individual or entity. It is not a substitute for professional advice or services. Any actions you take based on the information provided here are strictly at your own risk. You accept full responsibility for any decisions or outcomes arising from your use of this website and agree to release us from any liability in connection with your use of, or reliance upon, the content or products found herein.