
|
Boai Nky Medical Holdings Ltd. (300109.SZ) Avaliação DCF |
Totalmente Editável: Adapte-Se Às Suas Necessidades No Excel Ou Planilhas
Design Profissional: Modelos Confiáveis E Padrão Da Indústria
Pré-Construídos Para Uso Rápido E Eficiente
Compatível com MAC/PC, totalmente desbloqueado
Não É Necessária Experiência; Fácil De Seguir
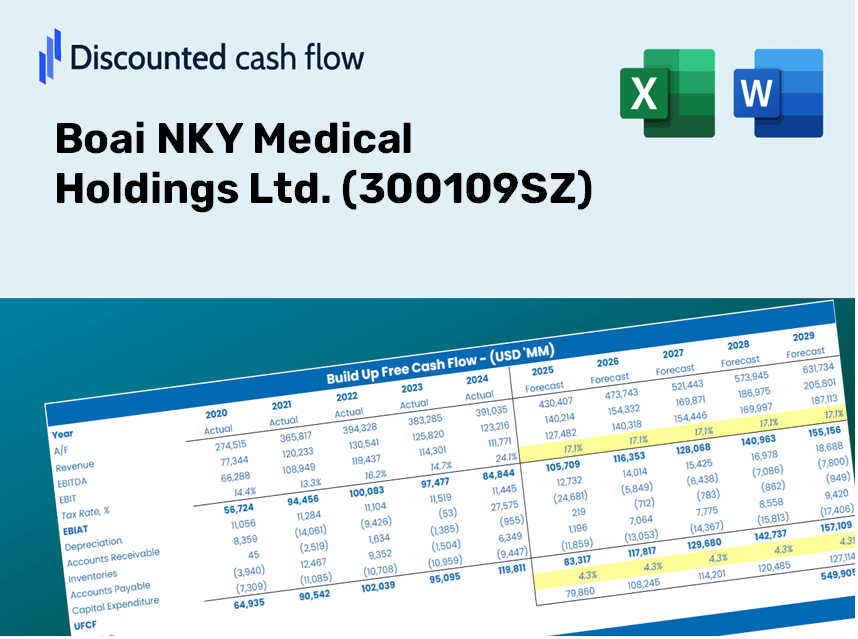
Boai NKY Medical Holdings Ltd. (300109.SZ) Bundle
Projetado para precisão, a nossa calculadora DCF (300109SZ) capacita a avaliação da Boai Nky Medical Holdings Ltd. usando dados financeiros do mundo real, fornecendo a flexibilidade para modificar todos os parâmetros essenciais para obter projeções aprimoradas.
Discounted Cash Flow (DCF) - (USD MM)
| Year | AY1 2020 |
AY2 2021 |
AY3 2022 |
AY4 2023 |
AY5 2024 |
FY1 2025 |
FY2 2026 |
FY3 2027 |
FY4 2028 |
FY5 2029 |
|---|---|---|---|---|---|---|---|---|---|---|
| Revenue | 978.5 | 1,220.3 | 1,485.7 | 1,583.4 | 1,606.3 | 1,825.1 | 2,073.7 | 2,356.1 | 2,677.0 | 3,041.6 |
| Revenue Growth, % | 0 | 24.71 | 21.75 | 6.58 | 1.45 | 13.62 | 13.62 | 13.62 | 13.62 | 13.62 |
| EBITDA | 171.0 | 409.0 | 460.5 | 665.3 | 510.4 | 568.6 | 646.1 | 734.1 | 834.1 | 947.7 |
| EBITDA, % | 17.48 | 33.52 | 31 | 42.02 | 31.77 | 31.16 | 31.16 | 31.16 | 31.16 | 31.16 |
| Depreciation | 56.3 | 76.2 | 65.8 | 76.9 | 102.1 | 100.9 | 114.6 | 130.3 | 148.0 | 168.2 |
| Depreciation, % | 5.75 | 6.24 | 4.43 | 4.86 | 6.36 | 5.53 | 5.53 | 5.53 | 5.53 | 5.53 |
| EBIT | 114.8 | 332.8 | 394.7 | 588.4 | 408.3 | 467.7 | 531.5 | 603.8 | 686.1 | 779.5 |
| EBIT, % | 11.73 | 27.27 | 26.56 | 37.16 | 25.42 | 25.63 | 25.63 | 25.63 | 25.63 | 25.63 |
| Total Cash | 276.7 | 1,363.8 | 576.9 | 325.0 | 578.3 | 816.3 | 927.5 | 1,053.8 | 1,197.3 | 1,360.4 |
| Total Cash, percent | .0 | .0 | .0 | .0 | .0 | .0 | .0 | .0 | .0 | .0 |
| Account Receivables | 544.9 | 417.9 | 477.9 | 411.5 | 441.0 | 640.8 | 728.0 | 827.2 | 939.9 | 1,067.9 |
| Account Receivables, % | 55.69 | 34.24 | 32.17 | 25.99 | 27.46 | 35.11 | 35.11 | 35.11 | 35.11 | 35.11 |
| Inventories | 185.8 | 230.4 | 247.0 | 309.8 | 377.5 | 356.1 | 404.6 | 459.7 | 522.3 | 593.5 |
| Inventories, % | 18.98 | 18.88 | 16.62 | 19.57 | 23.5 | 19.51 | 19.51 | 19.51 | 19.51 | 19.51 |
| Accounts Payable | 156.4 | 188.3 | 211.2 | 260.1 | 194.7 | 270.8 | 307.6 | 349.5 | 397.2 | 451.2 |
| Accounts Payable, % | 15.99 | 15.43 | 14.22 | 16.43 | 12.12 | 14.84 | 14.84 | 14.84 | 14.84 | 14.84 |
| Capital Expenditure | -99.2 | -228.3 | -266.0 | -377.9 | -274.7 | -320.2 | -363.8 | -413.4 | -469.7 | -533.6 |
| Capital Expenditure, % | -10.14 | -18.71 | -17.9 | -23.87 | -17.1 | -17.54 | -17.54 | -17.54 | -17.54 | -17.54 |
| Tax Rate, % | 12.86 | 12.86 | 12.86 | 12.86 | 12.86 | 12.86 | 12.86 | 12.86 | 12.86 | 12.86 |
| EBITAT | 55.9 | 242.2 | 296.1 | 495.5 | 355.8 | 344.1 | 391.0 | 444.3 | 504.8 | 573.5 |
| Depreciation | ||||||||||
| Changes in Account Receivables | ||||||||||
| Changes in Inventories | ||||||||||
| Changes in Accounts Payable | ||||||||||
| Capital Expenditure | ||||||||||
| UFCF | -561.3 | 204.3 | 42.3 | 247.1 | 20.6 | 22.5 | 42.9 | 48.8 | 55.4 | 63.0 |
| WACC, % | 4.57 | 4.6 | 4.6 | 4.61 | 4.62 | 4.6 | 4.6 | 4.6 | 4.6 | 4.6 |
| PV UFCF | ||||||||||
| SUM PV UFCF | 200.0 | |||||||||
| Long Term Growth Rate, % | 3.50 | |||||||||
| Free cash flow (T + 1) | 65 | |||||||||
| Terminal Value | 5,925 | |||||||||
| Present Terminal Value | 4,732 | |||||||||
| Enterprise Value | 4,932 | |||||||||
| Net Debt | -254 | |||||||||
| Equity Value | 5,186 | |||||||||
| Diluted Shares Outstanding, MM | 486 | |||||||||
| Equity Value Per Share | 10.68 |
Benefits You Will Receive
- Pre-Filled Financial Model: Utilizing Boai NKY Medical Holdings Ltd.'s (300109SZ) real data for accurate DCF valuation.
- Comprehensive Forecast Control: Modify revenue growth, profit margins, WACC, and other critical factors at your discretion.
- Real-Time Calculations: Automatic updates provide immediate visibility of results as adjustments are made.
- Professional-Grade Template: An expertly crafted Excel file ready for investment presentations.
- Flexible and Reusable: Designed for easy customization, allowing for ongoing use in detailed financial forecasts.
Key Features
- Real-Life 300109SZ Data: Pre-filled with Boai NKY Medical Holdings Ltd.'s historical financials and forward-looking projections.
- Fully Customizable Inputs: Modify revenue growth, profit margins, WACC, tax rates, and capital expenditures to suit your analysis.
- Dynamic Valuation Model: Automatically calculates Net Present Value (NPV) and intrinsic value based on your specified inputs.
- Scenario Testing: Develop multiple forecasting scenarios to evaluate various valuation results.
- User-Friendly Design: Intuitive and organized layout, designed for both industry professionals and newcomers.
How It Functions
- Download: Obtain the pre-filled Excel file featuring financial data for Boai NKY Medical Holdings Ltd. (300109SZ).
- Customize: Tailor your forecasts by adjusting revenue growth, EBITDA %, and WACC.
- Update Automatically: Watch as intrinsic value and NPV calculations refresh in real-time.
- Test Scenarios: Develop various projections and instantly compare their outcomes.
- Make Decisions: Leverage the valuation insights to inform your investment strategy.
Why Choose Boai NKY Medical Holdings Ltd. (300109SZ)?
- Time-Saving Solution: Skip the hassle of building a DCF model – our calculator is ready for immediate use.
- Enhanced Precision: Dependable financial data and formulas help minimize valuation errors.
- Completely Customizable: Adjust the model to mirror your specific assumptions and forecasts.
- User-Friendly Design: Intuitive charts and outputs facilitate straightforward analysis of results.
- Expert Approval: Crafted for professionals who prioritize accuracy and ease of use.
Who Can Benefit from This Product?
- Investors: Assess Boai NKY Medical Holdings Ltd.'s (300109SZ) valuation prior to making investment decisions.
- CFOs and Financial Analysts: Optimize valuation workflows and evaluate financial forecasts.
- Startup Founders: Gain insights into how leading public firms like Boai NKY Medical Holdings Ltd. (300109SZ) are appraised.
- Consultants: Provide comprehensive valuation reports for your clients focused on Boai NKY Medical Holdings Ltd. (300109SZ).
- Students and Educators: Utilize authentic data to practice and teach valuation methodologies.
Contents of the Template
- Comprehensive DCF Model: An editable template featuring detailed valuation calculations.
- Real-World Data: Preloaded historical and projected financials for Boai NKY Medical Holdings Ltd. (300109SZ) to facilitate analysis.
- Customizable Parameters: Modify WACC, growth rates, and tax assumptions for scenario testing.
- Financial Statements: Complete annual and quarterly breakdowns to provide in-depth insights.
- Key Ratios: Integrated analysis covering profitability, efficiency, and leverage metrics.
- Dashboard with Visual Outputs: Includes charts and tables for clear and actionable results.
Disclaimer
All information, articles, and product details provided on this website are for general informational and educational purposes only. We do not claim any ownership over, nor do we intend to infringe upon, any trademarks, copyrights, logos, brand names, or other intellectual property mentioned or depicted on this site. Such intellectual property remains the property of its respective owners, and any references here are made solely for identification or informational purposes, without implying any affiliation, endorsement, or partnership.
We make no representations or warranties, express or implied, regarding the accuracy, completeness, or suitability of any content or products presented. Nothing on this website should be construed as legal, tax, investment, financial, medical, or other professional advice. In addition, no part of this site—including articles or product references—constitutes a solicitation, recommendation, endorsement, advertisement, or offer to buy or sell any securities, franchises, or other financial instruments, particularly in jurisdictions where such activity would be unlawful.
All content is of a general nature and may not address the specific circumstances of any individual or entity. It is not a substitute for professional advice or services. Any actions you take based on the information provided here are strictly at your own risk. You accept full responsibility for any decisions or outcomes arising from your use of this website and agree to release us from any liability in connection with your use of, or reliance upon, the content or products found herein.