
|
Shanghai Taisheng Wind Power Equipment Co., Ltd. (300129.SZ) Avaliação DCF |
Totalmente Editável: Adapte-Se Às Suas Necessidades No Excel Ou Planilhas
Design Profissional: Modelos Confiáveis E Padrão Da Indústria
Pré-Construídos Para Uso Rápido E Eficiente
Compatível com MAC/PC, totalmente desbloqueado
Não É Necessária Experiência; Fácil De Seguir
Shanghai Taisheng Wind Power Equipment Co., Ltd. (300129.SZ) Bundle
Avalie as perspectivas financeiras da Shanghai Taisheng Wind Power Equipment Co., Ltd. Como um especialista! Esta calculadora DCF (300129SZ) fornece dados financeiros pré-preenchidos e flexibilidade total para modificar o crescimento da receita, o WACC, as margens e outras suposições importantes para se alinhar às suas previsões.
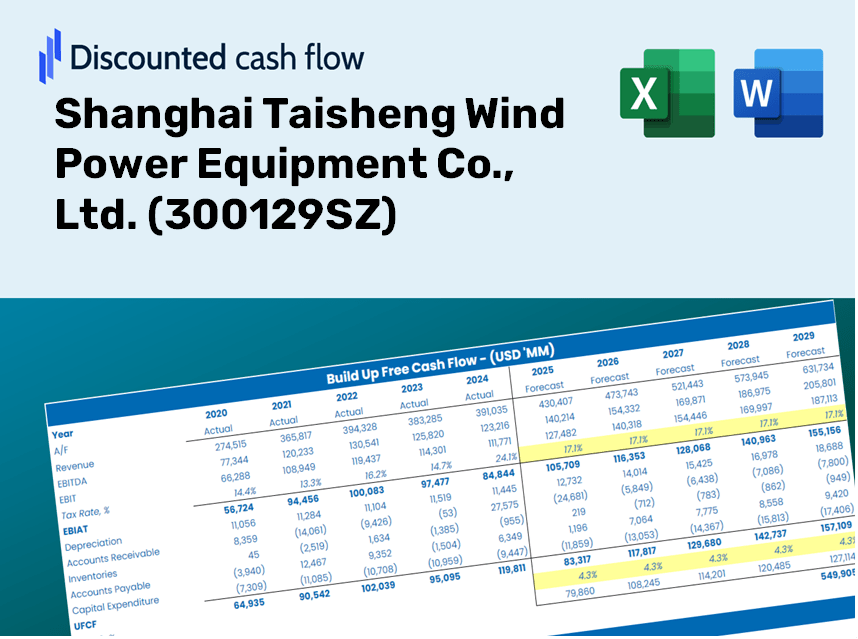
Discounted Cash Flow (DCF) - (USD MM)
| Year | AY1 2020 |
AY2 2021 |
AY3 2022 |
AY4 2023 |
AY5 2024 |
FY1 2025 |
FY2 2026 |
FY3 2027 |
FY4 2028 |
FY5 2029 |
|---|---|---|---|---|---|---|---|---|---|---|
| Revenue | 3,604.0 | 3,852.7 | 3,126.7 | 4,813.1 | 4,837.8 | 5,351.9 | 5,920.7 | 6,549.9 | 7,245.9 | 8,015.9 |
| Revenue Growth, % | 0 | 6.9 | -18.84 | 53.93 | 0.51501 | 10.63 | 10.63 | 10.63 | 10.63 | 10.63 |
| EBITDA | 514.0 | 383.6 | 415.6 | 471.6 | 399.6 | 594.8 | 658.0 | 727.9 | 805.3 | 890.9 |
| EBITDA, % | 14.26 | 9.96 | 13.29 | 9.8 | 8.26 | 11.11 | 11.11 | 11.11 | 11.11 | 11.11 |
| Depreciation | 78.7 | 83.9 | 97.9 | 116.3 | 151.7 | 139.6 | 154.5 | 170.9 | 189.1 | 209.1 |
| Depreciation, % | 2.18 | 2.18 | 3.13 | 2.42 | 3.14 | 2.61 | 2.61 | 2.61 | 2.61 | 2.61 |
| EBIT | 435.3 | 299.7 | 317.7 | 355.3 | 247.9 | 455.2 | 503.5 | 557.0 | 616.2 | 681.7 |
| EBIT, % | 12.08 | 7.78 | 10.16 | 7.38 | 5.12 | 8.5 | 8.5 | 8.5 | 8.5 | 8.5 |
| Total Cash | 905.9 | 819.9 | 1,427.6 | 866.7 | 1,116.3 | 1,425.3 | 1,576.8 | 1,744.3 | 1,929.7 | 2,134.7 |
| Total Cash, percent | .0 | .0 | .0 | .0 | .0 | .0 | .0 | .0 | .0 | .0 |
| Account Receivables | 1,800.6 | 2,094.1 | 2,284.4 | 2,977.6 | 3,907.6 | 3,425.4 | 3,789.4 | 4,192.1 | 4,637.6 | 5,130.4 |
| Account Receivables, % | 49.96 | 54.35 | 73.06 | 61.87 | 80.77 | 64 | 64 | 64 | 64 | 64 |
| Inventories | 1,012.0 | 1,509.7 | 1,802.9 | 1,778.2 | 1,887.6 | 2,150.3 | 2,378.8 | 2,631.6 | 2,911.3 | 3,220.6 |
| Inventories, % | 28.08 | 39.19 | 57.66 | 36.95 | 39.02 | 40.18 | 40.18 | 40.18 | 40.18 | 40.18 |
| Accounts Payable | 199.9 | 2,410.3 | 2,169.7 | 2,591.6 | 3,000.0 | 2,711.9 | 3,000.1 | 3,318.9 | 3,671.6 | 4,061.7 |
| Accounts Payable, % | 5.55 | 62.56 | 69.39 | 53.85 | 62.01 | 50.67 | 50.67 | 50.67 | 50.67 | 50.67 |
| Capital Expenditure | -23.4 | -89.9 | -173.6 | -435.6 | -280.1 | -250.2 | -276.8 | -306.2 | -338.8 | -374.8 |
| Capital Expenditure, % | -0.65047 | -2.33 | -5.55 | -9.05 | -5.79 | -4.68 | -4.68 | -4.68 | -4.68 | -4.68 |
| Tax Rate, % | 15.14 | 15.14 | 15.14 | 15.14 | 15.14 | 15.14 | 15.14 | 15.14 | 15.14 | 15.14 |
| EBITAT | 353.6 | 269.4 | 293.5 | 310.2 | 210.4 | 396.6 | 438.8 | 485.4 | 537.0 | 594.0 |
| Depreciation | ||||||||||
| Changes in Account Receivables | ||||||||||
| Changes in Inventories | ||||||||||
| Changes in Accounts Payable | ||||||||||
| Capital Expenditure | ||||||||||
| UFCF | -2,203.8 | 1,682.5 | -506.3 | -255.7 | -548.8 | 217.4 | 12.1 | 13.4 | 14.8 | 16.4 |
| WACC, % | 4.46 | 4.5 | 4.51 | 4.49 | 4.48 | 4.49 | 4.49 | 4.49 | 4.49 | 4.49 |
| PV UFCF | ||||||||||
| SUM PV UFCF | 256.4 | |||||||||
| Long Term Growth Rate, % | 4.00 | |||||||||
| Free cash flow (T + 1) | 17 | |||||||||
| Terminal Value | 3,501 | |||||||||
| Present Terminal Value | 2,811 | |||||||||
| Enterprise Value | 3,068 | |||||||||
| Net Debt | -32 | |||||||||
| Equity Value | 3,100 | |||||||||
| Diluted Shares Outstanding, MM | 935 | |||||||||
| Equity Value Per Share | 3.32 |
What You Will Receive
- Adjustable Forecast Inputs: Effortlessly modify assumptions (growth %, profit margins, WACC) to explore various scenarios.
- Actual Market Data: Pre-loaded financial information for Shanghai Taisheng Wind Power Equipment Co., Ltd. (300129SZ) to enhance your analysis.
- Automated DCF Outputs: The template computes Net Present Value (NPV) and intrinsic value for you automatically.
- Customizable and Professional Design: A sleek Excel model tailored to meet your valuation requirements.
- Designed for Analysts and Investors: Perfect for assessing projections, verifying strategies, and increasing efficiency.
Key Features
- Comprehensive Historical Data: Access Shanghai Taisheng Wind Power Equipment Co., Ltd.’s (300129SZ) past financial statements and established forecasts.
- Customizable Parameters: Adjust inputs such as WACC, tax rates, revenue growth, and EBITDA margins to fit your analysis.
- Real-Time Valuation Updates: Watch the recalculation of Shanghai Taisheng Wind Power Equipment Co., Ltd.’s (300129SZ) intrinsic value as you modify inputs.
- Intuitive Visual Representations: Utilize dashboard charts that showcase valuation results and essential financial metrics.
- Designed for Precision: A specialized tool tailored for analysts, investors, and finance professionals.
How It Operates
- Download: Obtain the pre-prepared Excel file containing the financial data for Shanghai Taisheng Wind Power Equipment Co., Ltd. (300129SZ).
- Customize: Modify projections, including revenue growth, EBITDA margin, and WACC.
- Update in Real-Time: The calculations for intrinsic value and NPV refresh automatically.
- Simulate Scenarios: Develop various forecasts and instantly analyze the results.
- Make Informed Choices: Leverage the valuation findings to shape your investment approach.
Why Choose This Calculator for Shanghai Taisheng Wind Power Equipment Co., Ltd. (300129SZ)?
- All-in-One Solution: Combines DCF, WACC, and financial ratio analyses tailored for the wind power sector.
- Flexible Inputs: Modify yellow-highlighted cells to explore different financial scenarios.
- In-Depth Analysis: Automatically computes the intrinsic value and Net Present Value for Shanghai Taisheng Wind Power Equipment.
- Preloaded Information: Features historical and projected data for precise analysis.
- High-Quality Standards: Perfect for financial analysts, investors, and consultants focusing on renewable energy.
Who Can Benefit from This Product?
- Individual Investors: Make well-informed decisions on trading shares of Shanghai Taisheng Wind Power Equipment Co., Ltd. (300129SZ).
- Financial Analysts: Enhance valuation accuracy with comprehensive financial models tailored for the wind power sector.
- Consultants: Provide clients with timely and precise valuation insights related to Shanghai Taisheng Wind Power Equipment Co., Ltd. (300129SZ).
- Business Owners: Gain insights into the valuation of major players in the wind power industry to inform your own business strategies.
- Finance Students: Acquire practical knowledge of valuation methods using real data and case studies from Shanghai Taisheng Wind Power Equipment Co., Ltd. (300129SZ).
Contents of the Template
- Operating and Balance Sheet Data: Pre-filled historical data and forecasts for Shanghai Taisheng Wind Power Equipment Co., Ltd. (300129SZ), including revenue, EBITDA, EBIT, and capital expenditures.
- WACC Calculation: A dedicated sheet for the Weighted Average Cost of Capital (WACC), featuring parameters such as Beta, risk-free rate, and share price.
- DCF Valuation (Unlevered and Levered): Editable Discounted Cash Flow models that display intrinsic value along with comprehensive calculations.
- Financial Statements: Pre-loaded annual and quarterly financial statements to facilitate thorough analysis.
- Key Ratios: Provides profitability, leverage, and efficiency ratios specific to Shanghai Taisheng Wind Power Equipment Co., Ltd. (300129SZ).
- Dashboard and Charts: A visual summary of valuation outputs and assumptions designed for easy analysis of results.
Disclaimer
All information, articles, and product details provided on this website are for general informational and educational purposes only. We do not claim any ownership over, nor do we intend to infringe upon, any trademarks, copyrights, logos, brand names, or other intellectual property mentioned or depicted on this site. Such intellectual property remains the property of its respective owners, and any references here are made solely for identification or informational purposes, without implying any affiliation, endorsement, or partnership.
We make no representations or warranties, express or implied, regarding the accuracy, completeness, or suitability of any content or products presented. Nothing on this website should be construed as legal, tax, investment, financial, medical, or other professional advice. In addition, no part of this site—including articles or product references—constitutes a solicitation, recommendation, endorsement, advertisement, or offer to buy or sell any securities, franchises, or other financial instruments, particularly in jurisdictions where such activity would be unlawful.
All content is of a general nature and may not address the specific circumstances of any individual or entity. It is not a substitute for professional advice or services. Any actions you take based on the information provided here are strictly at your own risk. You accept full responsibility for any decisions or outcomes arising from your use of this website and agree to release us from any liability in connection with your use of, or reliance upon, the content or products found herein.