
|
Walvax Biotechnology Co., Ltd. (300142.SZ) Avaliação DCF |
Totalmente Editável: Adapte-Se Às Suas Necessidades No Excel Ou Planilhas
Design Profissional: Modelos Confiáveis E Padrão Da Indústria
Pré-Construídos Para Uso Rápido E Eficiente
Compatível com MAC/PC, totalmente desbloqueado
Não É Necessária Experiência; Fácil De Seguir
Walvax Biotechnology Co., Ltd. (300142.SZ) Bundle
Simplifique a avaliação Walvax Biotechnology Co., Ltd. (300142SZ) com esta calculadora DCF personalizável! Com o Real Walvax Biotechnology Co., Ltd. (300142SZ) e entradas de previsão ajustáveis, você pode testar cenários e descobrir o valor justo Walvax Biotechnology Co., Ltd. (300142SZ) em minutos.
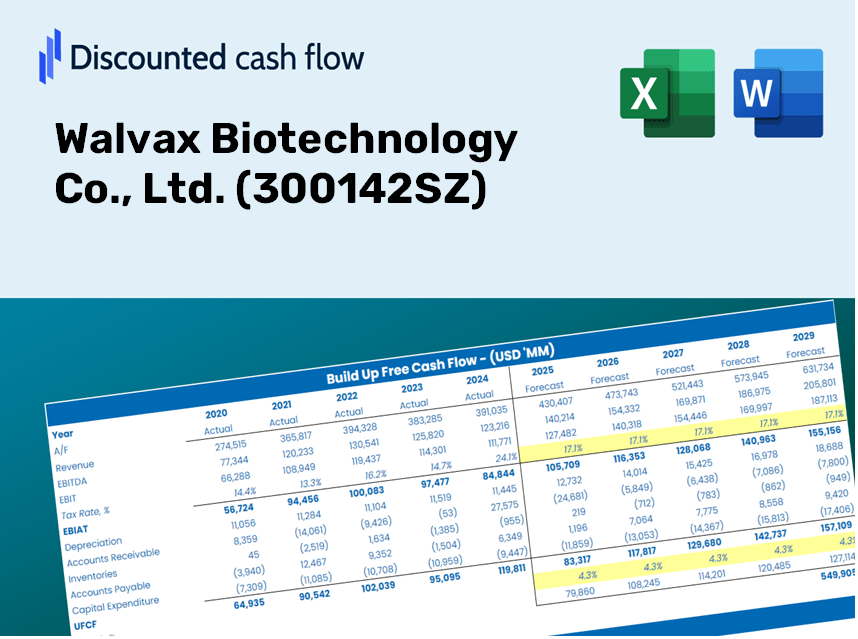
Discounted Cash Flow (DCF) - (USD MM)
| Year | AY1 2020 |
AY2 2021 |
AY3 2022 |
AY4 2023 |
AY5 2024 |
FY1 2025 |
FY2 2026 |
FY3 2027 |
FY4 2028 |
FY5 2029 |
|---|---|---|---|---|---|---|---|---|---|---|
| Revenue | 2,939.0 | 3,462.8 | 5,086.4 | 4,113.8 | 2,821.4 | 2,921.4 | 3,024.9 | 3,132.1 | 3,243.0 | 3,358.0 |
| Revenue Growth, % | 0 | 17.82 | 46.89 | -19.12 | -31.41 | 3.54 | 3.54 | 3.54 | 3.54 | 3.54 |
| EBITDA | 1,147.9 | 927.7 | 1,422.3 | 1,121.0 | 387.6 | 787.6 | 815.5 | 844.4 | 874.3 | 905.3 |
| EBITDA, % | 39.06 | 26.79 | 27.96 | 27.25 | 13.74 | 26.96 | 26.96 | 26.96 | 26.96 | 26.96 |
| Depreciation | 123.9 | 135.4 | 248.4 | 290.0 | 363.6 | 192.5 | 199.3 | 206.4 | 213.7 | 221.3 |
| Depreciation, % | 4.22 | 3.91 | 4.88 | 7.05 | 12.89 | 6.59 | 6.59 | 6.59 | 6.59 | 6.59 |
| EBIT | 1,023.9 | 792.2 | 1,173.9 | 831.0 | 24.0 | 595.1 | 616.2 | 638.0 | 660.6 | 684.0 |
| EBIT, % | 34.84 | 22.88 | 23.08 | 20.2 | 0.85108 | 20.37 | 20.37 | 20.37 | 20.37 | 20.37 |
| Total Cash | 1,961.6 | 3,443.4 | 3,873.5 | 4,364.5 | 3,763.6 | 2,584.5 | 2,676.0 | 2,770.9 | 2,869.0 | 2,970.7 |
| Total Cash, percent | .0 | .0 | .0 | .0 | .0 | .0 | .0 | .0 | .0 | .0 |
| Account Receivables | 2,309.1 | 3,239.5 | 3,956.8 | 3,100.6 | 2,487.7 | 2,415.7 | 2,501.3 | 2,589.9 | 2,681.7 | 2,776.7 |
| Account Receivables, % | 78.57 | 93.55 | 77.79 | 75.37 | 88.17 | 82.69 | 82.69 | 82.69 | 82.69 | 82.69 |
| Inventories | 483.6 | 873.6 | 995.8 | 1,034.6 | 752.6 | 660.7 | 684.1 | 708.4 | 733.5 | 759.5 |
| Inventories, % | 16.45 | 25.23 | 19.58 | 25.15 | 26.67 | 22.62 | 22.62 | 22.62 | 22.62 | 22.62 |
| Accounts Payable | 607.8 | 1,258.1 | 1,484.2 | 1,772.4 | 1,397.8 | 1,044.8 | 1,081.8 | 1,120.2 | 1,159.8 | 1,200.9 |
| Accounts Payable, % | 20.68 | 36.33 | 29.18 | 43.09 | 49.54 | 35.76 | 35.76 | 35.76 | 35.76 | 35.76 |
| Capital Expenditure | -407.1 | -1,103.5 | -1,091.2 | -945.5 | -550.0 | -640.7 | -663.4 | -686.9 | -711.2 | -736.4 |
| Capital Expenditure, % | -13.85 | -31.87 | -21.45 | -22.98 | -19.49 | -21.93 | -21.93 | -21.93 | -21.93 | -21.93 |
| Tax Rate, % | 22.95 | 22.95 | 22.95 | 22.95 | 22.95 | 22.95 | 22.95 | 22.95 | 22.95 | 22.95 |
| EBITAT | 748.0 | 478.0 | 799.1 | 581.9 | 18.5 | 414.8 | 429.5 | 444.7 | 460.5 | 476.8 |
| Depreciation | ||||||||||
| Changes in Account Receivables | ||||||||||
| Changes in Inventories | ||||||||||
| Changes in Accounts Payable | ||||||||||
| Capital Expenditure | ||||||||||
| UFCF | -1,720.0 | -1,160.2 | -657.2 | 1,031.9 | 352.3 | -222.4 | -106.5 | -110.3 | -114.2 | -118.3 |
| WACC, % | 5.03 | 5.02 | 5.03 | 5.03 | 5.04 | 5.03 | 5.03 | 5.03 | 5.03 | 5.03 |
| PV UFCF | ||||||||||
| SUM PV UFCF | -589.9 | |||||||||
| Long Term Growth Rate, % | 4.00 | |||||||||
| Free cash flow (T + 1) | -123 | |||||||||
| Terminal Value | -11,953 | |||||||||
| Present Terminal Value | -9,352 | |||||||||
| Enterprise Value | -9,942 | |||||||||
| Net Debt | -3,318 | |||||||||
| Equity Value | -6,624 | |||||||||
| Diluted Shares Outstanding, MM | 1,599 | |||||||||
| Equity Value Per Share | -4.14 |
Benefits You Will Receive
- Authentic 300142SZ Financial Data: Pre-populated with Walvax Biotechnology’s historical and projected figures for detailed analysis.
- Completely Customizable Template: Easily adjust critical inputs such as revenue growth, WACC, and EBITDA percentage.
- Instant Calculations: Watch Walvax's intrinsic value refresh in real-time as you make adjustments.
- Professional Valuation Tool: Tailored for investors, analysts, and consultants aiming for precise DCF outcomes.
- User-Friendly Format: Straightforward layout and clear guidance suitable for all skill levels.
Key Features
- 🔍 Real-Life Walvax Financials: Pre-filled historical and projected data for Walvax Biotechnology Co., Ltd. (300142SZ).
- ✏️ Fully Customizable Inputs: Adjust all critical parameters (yellow cells) such as WACC, growth %, and tax rates.
- 📊 Professional DCF Valuation: Built-in formulas calculate Walvax’s intrinsic value using the Discounted Cash Flow method.
- ⚡ Instant Results: Visualize Walvax’s valuation immediately after making any changes.
- Scenario Analysis: Test and compare outcomes for various financial assumptions side-by-side.
How It Functions
- Download: Obtain the preformatted Excel file containing Walvax Biotechnology's financial data.
- Customize: Modify projections, such as revenue growth, EBITDA margin, and WACC.
- Update Automatically: Intrinsic value and NPV calculations refresh in real-time.
- Test Scenarios: Generate various forecasts and instantly compare results.
- Make Decisions: Utilize the valuation findings to inform your investment approach.
Why Opt for This Calculator?
- Reliable Data: Accurate financials from Walvax Biotechnology (300142SZ) ensure trustworthy valuation outcomes.
- Customizable Options: Tailor essential parameters such as growth projections, WACC, and tax rates to fit your analysis.
- Efficient: Pre-configured calculations save you the hassle of starting from scratch.
- Professional Quality: Specifically designed for investors, analysts, and consultants in the biotechnology field.
- Easy to Use: A user-friendly design with clear instructions allows for straightforward navigation for all users.
Who Should Consider This Product?
- Biotech Students: Explore valuation methodologies and practice with real-world data.
- Researchers: Integrate advanced models into your studies or academic projects.
- Investors: Validate your hypotheses and assess valuation results for Walvax Biotechnology Co., Ltd. (300142SZ).
- Market Analysts: Enhance your analysis process with a customizable, ready-to-use DCF model.
- Entrepreneurs: Discover how major biotech firms like Walvax are evaluated in the market.
Contents of the Template
- Pre-Populated Data: Features Walvax Biotechnology's historical financials and projections.
- Discounted Cash Flow Model: An editable DCF valuation model with real-time calculations.
- Weighted Average Cost of Capital (WACC): A specific worksheet for determining WACC using tailored inputs.
- Key Financial Ratios: Assess Walvax's profitability, efficiency, and leverage metrics.
- Customizable Parameters: Easily modify revenue growth rates, profit margins, and tax rates.
- User-Friendly Dashboard: Visualizations and tables that encapsulate essential valuation findings.
Disclaimer
All information, articles, and product details provided on this website are for general informational and educational purposes only. We do not claim any ownership over, nor do we intend to infringe upon, any trademarks, copyrights, logos, brand names, or other intellectual property mentioned or depicted on this site. Such intellectual property remains the property of its respective owners, and any references here are made solely for identification or informational purposes, without implying any affiliation, endorsement, or partnership.
We make no representations or warranties, express or implied, regarding the accuracy, completeness, or suitability of any content or products presented. Nothing on this website should be construed as legal, tax, investment, financial, medical, or other professional advice. In addition, no part of this site—including articles or product references—constitutes a solicitation, recommendation, endorsement, advertisement, or offer to buy or sell any securities, franchises, or other financial instruments, particularly in jurisdictions where such activity would be unlawful.
All content is of a general nature and may not address the specific circumstances of any individual or entity. It is not a substitute for professional advice or services. Any actions you take based on the information provided here are strictly at your own risk. You accept full responsibility for any decisions or outcomes arising from your use of this website and agree to release us from any liability in connection with your use of, or reliance upon, the content or products found herein.