
|
Tofflon Science and Technology Group Co., Ltd. (300171.sz) Avaliação DCF |
Totalmente Editável: Adapte-Se Às Suas Necessidades No Excel Ou Planilhas
Design Profissional: Modelos Confiáveis E Padrão Da Indústria
Pré-Construídos Para Uso Rápido E Eficiente
Compatível com MAC/PC, totalmente desbloqueado
Não É Necessária Experiência; Fácil De Seguir
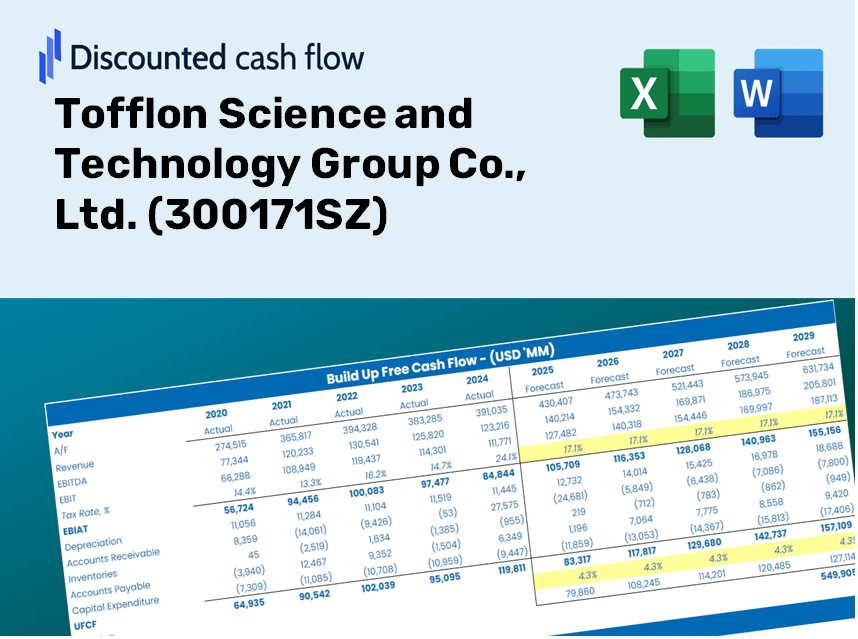
Tofflon Science and Technology Group Co., Ltd. (300171.SZ) Bundle
Avalie as perspectivas financeiras da Tofflon Science and Technology Group, Ltd. como um especialista! Esta calculadora DCF (300171SZ) fornece dados financeiros pré-populados e a liberdade de modificar o crescimento da receita, o WACC, as margens e outras suposições essenciais para se alinhar às suas previsões.
Discounted Cash Flow (DCF) - (USD MM)
| Year | AY1 2020 |
AY2 2021 |
AY3 2022 |
AY4 2023 |
AY5 2024 |
FY1 2025 |
FY2 2026 |
FY3 2027 |
FY4 2028 |
FY5 2029 |
|---|---|---|---|---|---|---|---|---|---|---|
| Revenue | 2,707.7 | 4,192.4 | 5,469.4 | 5,641.7 | 5,010.1 | 5,109.3 | 5,210.4 | 5,313.6 | 5,418.7 | 5,526.0 |
| Revenue Growth, % | 0 | 54.83 | 30.46 | 3.15 | -11.19 | 1.98 | 1.98 | 1.98 | 1.98 | 1.98 |
| EBITDA | 512.1 | 980.9 | 926.2 | 678.0 | 206.7 | 770.3 | 785.6 | 801.1 | 817.0 | 833.2 |
| EBITDA, % | 18.91 | 23.4 | 16.93 | 12.02 | 4.13 | 15.08 | 15.08 | 15.08 | 15.08 | 15.08 |
| Depreciation | 44.4 | 42.9 | 59.7 | 84.9 | 103.6 | 74.9 | 76.3 | 77.8 | 79.4 | 81.0 |
| Depreciation, % | 1.64 | 1.02 | 1.09 | 1.51 | 2.07 | 1.46 | 1.46 | 1.46 | 1.46 | 1.46 |
| EBIT | 467.7 | 938.1 | 866.4 | 593.1 | 103.1 | 695.5 | 709.3 | 723.3 | 737.6 | 752.2 |
| EBIT, % | 17.27 | 22.38 | 15.84 | 10.51 | 2.06 | 13.61 | 13.61 | 13.61 | 13.61 | 13.61 |
| Total Cash | 3,096.4 | 3,820.5 | 4,992.8 | 2,833.6 | 2,958.8 | 4,002.6 | 4,081.8 | 4,162.6 | 4,245.0 | 4,329.0 |
| Total Cash, percent | .0 | .0 | .0 | .0 | .0 | .0 | .0 | .0 | .0 | .0 |
| Account Receivables | 949.5 | 1,164.1 | 1,719.5 | 2,111.1 | 2,161.2 | 1,786.5 | 1,821.8 | 1,857.9 | 1,894.7 | 1,932.2 |
| Account Receivables, % | 35.07 | 27.77 | 31.44 | 37.42 | 43.14 | 34.97 | 34.97 | 34.97 | 34.97 | 34.97 |
| Inventories | 1,685.2 | 3,197.7 | 3,899.3 | 3,610.8 | 3,272.9 | 3,465.4 | 3,534.0 | 3,604.0 | 3,675.3 | 3,748.1 |
| Inventories, % | 62.24 | 76.27 | 71.29 | 64 | 65.32 | 67.83 | 67.83 | 67.83 | 67.83 | 67.83 |
| Accounts Payable | 496.9 | 911.1 | 939.9 | 1,165.4 | 1,177.9 | 1,036.5 | 1,057.0 | 1,077.9 | 1,099.3 | 1,121.0 |
| Accounts Payable, % | 18.35 | 21.73 | 17.18 | 20.66 | 23.51 | 20.29 | 20.29 | 20.29 | 20.29 | 20.29 |
| Capital Expenditure | -26.7 | -454.1 | -725.7 | -694.6 | -498.5 | -483.8 | -493.4 | -503.2 | -513.1 | -523.3 |
| Capital Expenditure, % | -0.98665 | -10.83 | -13.27 | -12.31 | -9.95 | -9.47 | -9.47 | -9.47 | -9.47 | -9.47 |
| Tax Rate, % | 14.54 | 14.54 | 14.54 | 14.54 | 14.54 | 14.54 | 14.54 | 14.54 | 14.54 | 14.54 |
| EBITAT | 394.5 | 761.6 | 731.7 | 502.3 | 88.1 | 584.4 | 595.9 | 607.7 | 619.8 | 632.0 |
| Depreciation | ||||||||||
| Changes in Account Receivables | ||||||||||
| Changes in Inventories | ||||||||||
| Changes in Accounts Payable | ||||||||||
| Capital Expenditure | ||||||||||
| UFCF | -1,725.7 | -962.6 | -1,162.5 | 15.0 | -6.5 | 216.2 | 95.4 | 97.3 | 99.2 | 101.2 |
| WACC, % | 4.55 | 4.55 | 4.55 | 4.55 | 4.55 | 4.55 | 4.55 | 4.55 | 4.55 | 4.55 |
| PV UFCF | ||||||||||
| SUM PV UFCF | 543.3 | |||||||||
| Long Term Growth Rate, % | 2.00 | |||||||||
| Free cash flow (T + 1) | 103 | |||||||||
| Terminal Value | 4,041 | |||||||||
| Present Terminal Value | 3,234 | |||||||||
| Enterprise Value | 3,778 | |||||||||
| Net Debt | -2,500 | |||||||||
| Equity Value | 6,278 | |||||||||
| Diluted Shares Outstanding, MM | 747 | |||||||||
| Equity Value Per Share | 8.41 |
What You Will Receive
- Authentic Tofflon Data: Comprehensive financial information – from revenue to EBIT – based on historical and projected statistics.
- Complete Customization: Modify all essential parameters (yellow cells) such as WACC, growth %, and tax rates.
- Real-Time Valuation Adjustments: Automatic updates to evaluate the effects of changes on Tofflon's fair value.
- Flexible Excel Template: Designed for easy modifications, scenario analysis, and thorough forecasts.
- Efficient and Accurate: Skip constructing models from the ground up while ensuring accuracy and adaptability.
Key Features
- Comprehensive Historical Data: Access to Tofflon Science and Technology Group Co., Ltd.’s (300171SZ) past financial statements and well-defined forecasts.
- Customizable Parameters: Adjust WACC, tax rates, revenue growth, and EBITDA margins to suit your analysis.
- Real-Time Valuation: Watch as Tofflon’s (300171SZ) intrinsic value updates instantly with your inputs.
- Intuitive Visualizations: Easily interpret valuation results and key metrics through dynamic dashboard charts.
- Designed for Precision: A reliable tool tailored for analysts, investors, and finance professionals.
How It Functions
- Download the Template: Gain immediate access to the Excel-based Tofflon (300171SZ) DCF Calculator.
- Input Your Assumptions: Modify the yellow-highlighted cells for growth rates, WACC, profit margins, and additional factors.
- Instant Calculations: The model automatically recalculates Tofflon’s intrinsic value.
- Test Scenarios: Experiment with various assumptions to assess potential changes in valuation.
- Analyze and Decide: Utilize the results to inform your investment or financial assessments.
Why Choose Tofflon's Calculator?
- Precision: Utilizes accurate financial data from Tofflon Science and Technology Group Co., Ltd. ([300171SZ]) to ensure reliability.
- Adaptability: Engineered for users to easily test and adjust inputs at their discretion.
- Efficiency: Eliminate the hassle of constructing a DCF model from the ground up.
- Expert-Quality: Crafted with the precision and functionality expected by CFOs.
- Intuitive Design: Simple to navigate, making it accessible for users with varying levels of financial modeling expertise.
Who Should Utilize This Product?
- Investors: Accurately assess the fair value of Tofflon Science and Technology Group Co., Ltd. (300171SZ) before making investment choices.
- CFOs: Utilize a professional-grade DCF model for comprehensive financial reporting and analysis within the company.
- Consultants: Efficiently modify the template for valuation reports tailored to clients' needs.
- Entrepreneurs: Acquire valuable insights into financial modeling techniques employed by leading companies.
- Educators: Employ it as an instructional resource to illustrate various valuation methodologies.
What the Template Contains
- Pre-Filled DCF Model: Tofflon’s financial data preloaded for immediate application.
- WACC Calculator: Comprehensive calculations for Weighted Average Cost of Capital.
- Financial Ratios: Assess Tofflon’s profitability, leverage, and operational efficiency.
- Editable Inputs: Modify assumptions such as growth rates, profit margins, and capital expenditures to align with your scenarios.
- Financial Statements: Annual and quarterly reports to facilitate in-depth analysis.
- Interactive Dashboard: Effortlessly visualize key valuation metrics and outcomes.
Disclaimer
All information, articles, and product details provided on this website are for general informational and educational purposes only. We do not claim any ownership over, nor do we intend to infringe upon, any trademarks, copyrights, logos, brand names, or other intellectual property mentioned or depicted on this site. Such intellectual property remains the property of its respective owners, and any references here are made solely for identification or informational purposes, without implying any affiliation, endorsement, or partnership.
We make no representations or warranties, express or implied, regarding the accuracy, completeness, or suitability of any content or products presented. Nothing on this website should be construed as legal, tax, investment, financial, medical, or other professional advice. In addition, no part of this site—including articles or product references—constitutes a solicitation, recommendation, endorsement, advertisement, or offer to buy or sell any securities, franchises, or other financial instruments, particularly in jurisdictions where such activity would be unlawful.
All content is of a general nature and may not address the specific circumstances of any individual or entity. It is not a substitute for professional advice or services. Any actions you take based on the information provided here are strictly at your own risk. You accept full responsibility for any decisions or outcomes arising from your use of this website and agree to release us from any liability in connection with your use of, or reliance upon, the content or products found herein.