
|
Sunwoda Electronic Co., Ltd (300207.sz) Avaliação DCF |
Totalmente Editável: Adapte-Se Às Suas Necessidades No Excel Ou Planilhas
Design Profissional: Modelos Confiáveis E Padrão Da Indústria
Pré-Construídos Para Uso Rápido E Eficiente
Compatível com MAC/PC, totalmente desbloqueado
Não É Necessária Experiência; Fácil De Seguir
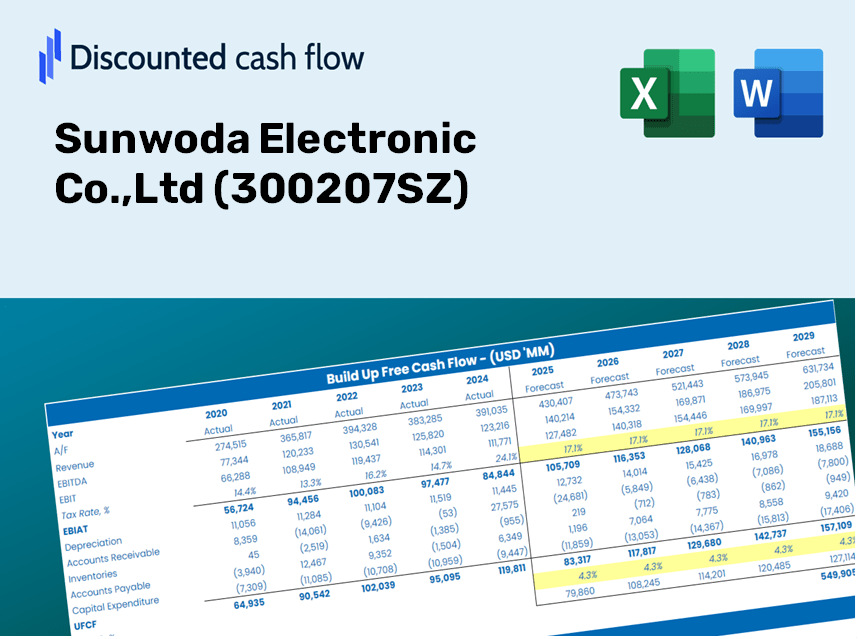
Sunwoda Electronic Co.,Ltd (300207.SZ) Bundle
Seja você um investidor ou analista, esta calculadora DCF (300207SZ) é o seu recurso preferido para uma avaliação precisa. Carregado com dados reais da Sunwoda Electronic Co., LTD, você pode ajustar as previsões e observar imediatamente os efeitos.
Discounted Cash Flow (DCF) - (USD MM)
| Year | AY1 2020 |
AY2 2021 |
AY3 2022 |
AY4 2023 |
AY5 2024 |
FY1 2025 |
FY2 2026 |
FY3 2027 |
FY4 2028 |
FY5 2029 |
|---|---|---|---|---|---|---|---|---|---|---|
| Revenue | 29,692.3 | 37,358.7 | 52,162.3 | 47,862.2 | 56,020.6 | 66,419.0 | 78,747.6 | 93,364.5 | 110,694.6 | 131,241.4 |
| Revenue Growth, % | 0 | 25.82 | 39.63 | -8.24 | 17.05 | 18.56 | 18.56 | 18.56 | 18.56 | 18.56 |
| EBITDA | 1,388.2 | 1,925.9 | 2,129.4 | 1,955.0 | 2,956.9 | 3,091.9 | 3,665.8 | 4,346.2 | 5,152.9 | 6,109.4 |
| EBITDA, % | 4.68 | 5.16 | 4.08 | 4.08 | 5.28 | 4.66 | 4.66 | 4.66 | 4.66 | 4.66 |
| Depreciation | 511.5 | 806.9 | 1,213.5 | 1,566.9 | 1,742.2 | 1,672.8 | 1,983.3 | 2,351.4 | 2,787.8 | 3,305.3 |
| Depreciation, % | 1.72 | 2.16 | 2.33 | 3.27 | 3.11 | 2.52 | 2.52 | 2.52 | 2.52 | 2.52 |
| EBIT | 876.7 | 1,119.1 | 915.9 | 388.1 | 1,214.7 | 1,419.1 | 1,682.5 | 1,994.8 | 2,365.1 | 2,804.1 |
| EBIT, % | 2.95 | 3 | 1.76 | 0.81093 | 2.17 | 2.14 | 2.14 | 2.14 | 2.14 | 2.14 |
| Total Cash | 4,605.6 | 8,367.7 | 19,464.0 | 18,841.5 | 18,052.8 | 19,502.6 | 23,122.6 | 27,414.6 | 32,503.2 | 38,536.4 |
| Total Cash, percent | .0 | .0 | .0 | .0 | .0 | .0 | .0 | .0 | .0 | .0 |
| Account Receivables | 7,829.5 | 8,766.1 | 13,767.6 | 13,377.5 | 17,758.9 | 18,049.8 | 21,400.1 | 25,372.4 | 30,081.9 | 35,665.6 |
| Account Receivables, % | 26.37 | 23.46 | 26.39 | 27.95 | 31.7 | 27.18 | 27.18 | 27.18 | 27.18 | 27.18 |
| Inventories | 5,120.8 | 7,635.3 | 9,874.5 | 7,044.6 | 7,485.1 | 11,250.7 | 13,339.0 | 15,814.9 | 18,750.5 | 22,230.9 |
| Inventories, % | 17.25 | 20.44 | 18.93 | 14.72 | 13.36 | 16.94 | 16.94 | 16.94 | 16.94 | 16.94 |
| Accounts Payable | 9,793.1 | 13,365.5 | 23,172.7 | 13,268.8 | 24,984.0 | 24,641.9 | 29,215.8 | 34,638.8 | 41,068.4 | 48,691.4 |
| Accounts Payable, % | 32.98 | 35.78 | 44.42 | 27.72 | 44.6 | 37.1 | 37.1 | 37.1 | 37.1 | 37.1 |
| Capital Expenditure | -3,360.1 | -3,860.2 | -9,093.6 | -5,896.1 | -6,193.1 | -8,296.6 | -9,836.6 | -11,662.4 | -13,827.2 | -16,393.7 |
| Capital Expenditure, % | -11.32 | -10.33 | -17.43 | -12.32 | -11.06 | -12.49 | -12.49 | -12.49 | -12.49 | -12.49 |
| Tax Rate, % | -89.53 | -89.53 | -89.53 | -89.53 | -89.53 | -89.53 | -89.53 | -89.53 | -89.53 | -89.53 |
| EBITAT | 726.9 | 1,006.5 | 2,225.6 | 2,482.4 | 2,302.3 | 1,342.1 | 1,591.2 | 1,886.5 | 2,236.7 | 2,651.9 |
| Depreciation | ||||||||||
| Changes in Account Receivables | ||||||||||
| Changes in Inventories | ||||||||||
| Changes in Accounts Payable | ||||||||||
| Capital Expenditure | ||||||||||
| UFCF | -5,279.0 | -1,925.5 | -3,088.1 | -8,530.6 | 4,744.7 | -9,680.4 | -7,126.9 | -8,449.7 | -10,018.1 | -11,877.7 |
| WACC, % | 7.06 | 7.13 | 7.23 | 7.23 | 7.23 | 7.17 | 7.17 | 7.17 | 7.17 | 7.17 |
| PV UFCF | ||||||||||
| SUM PV UFCF | -38,096.3 | |||||||||
| Long Term Growth Rate, % | 3.50 | |||||||||
| Free cash flow (T + 1) | -12,293 | |||||||||
| Terminal Value | -334,766 | |||||||||
| Present Terminal Value | -236,772 | |||||||||
| Enterprise Value | -274,868 | |||||||||
| Net Debt | 432 | |||||||||
| Equity Value | -275,300 | |||||||||
| Diluted Shares Outstanding, MM | 1,859 | |||||||||
| Equity Value Per Share | -148.13 |
What You Will Receive
- Authentic Sunwoda Data: Comprehensive financial information – encompassing everything from revenue to EBIT – grounded in actual and anticipated figures.
- Complete Customization: Modify all essential parameters (yellow cells) such as WACC, growth %, and tax rates as needed.
- Immediate Valuation Revisions: Automatic updates to assess how changes affect Sunwoda's fair value.
- Flexible Excel Template: Designed for quick modifications, scenario analysis, and detailed forecasts.
- Efficient and Precise: Bypass the complexity of creating models from scratch while ensuring accuracy and adaptability.
Key Features
- 🔍 Real-Life Sunwoda Financials: Pre-filled historical and projected data for Sunwoda Electronic Co., Ltd (300207SZ).
- ✏️ Fully Customizable Inputs: Adjust all critical parameters (yellow cells) such as WACC, growth %, and tax rates.
- 📊 Professional DCF Valuation: Built-in formulas calculate Sunwoda’s intrinsic value using the Discounted Cash Flow method.
- ⚡ Instant Results: Visualize Sunwoda’s valuation immediately after making adjustments.
- Scenario Analysis: Evaluate and compare various financial assumptions side-by-side.
How It Functions
- 1. Access the Template: Download and open the Excel sheet containing Sunwoda Electronic Co., Ltd's preloaded data.
- 2. Modify Inputs: Adjust crucial parameters such as growth projections, WACC, and capital expenditures.
- 3. Get Instant Insights: The DCF model automatically computes the intrinsic value and NPV.
- 4. Explore Scenarios: Evaluate various forecasts to understand different valuation possibilities.
- 5. Present with Assurance: Deliver expert valuation findings to back up your strategic decisions.
Why Select This Calculator for Sunwoda Electronic Co., Ltd (300207SZ)?
- Precision: Based on actual financial data from Sunwoda for reliable results.
- Customization: Built to allow users to easily adjust and experiment with various inputs.
- Efficiency: Eliminate the need to create a DCF model from the ground up.
- Expert-Standard: Crafted with the accuracy and functionality expected at the CFO level.
- Intuitive Design: Simple to navigate, making it accessible for users without extensive financial modeling skills.
Who Can Benefit from This Product?
- Investors: Assess Sunwoda's valuation before making stock transactions.
- CFOs and Financial Analysts: Optimize valuation workflows and assess financial forecasts.
- Startup Founders: Gain insights into how leading companies like Sunwoda are appraised.
- Consultants: Create comprehensive valuation reports for your clients.
- Students and Educators: Utilize real-time data to refine and instruct valuation methodologies.
What the Template Contains
- Operating and Balance Sheet Data: Pre-filled historical data and projections for Sunwoda Electronic Co., Ltd (300207SZ), including revenue, EBITDA, EBIT, and capital expenditures.
- WACC Calculation: A dedicated sheet for calculating the Weighted Average Cost of Capital (WACC), with inputs such as Beta, risk-free rate, and share price.
- DCF Valuation (Unlevered and Levered): Customizable Discounted Cash Flow models demonstrating intrinsic value along with comprehensive calculations.
- Financial Statements: Pre-loaded annual and quarterly financial statements to facilitate thorough analysis.
- Key Ratios: Includes profitability, leverage, and efficiency ratios specific to Sunwoda Electronic Co., Ltd (300207SZ).
- Dashboard and Charts: Visual representations of valuation outputs and underlying assumptions for straightforward results analysis.
Disclaimer
All information, articles, and product details provided on this website are for general informational and educational purposes only. We do not claim any ownership over, nor do we intend to infringe upon, any trademarks, copyrights, logos, brand names, or other intellectual property mentioned or depicted on this site. Such intellectual property remains the property of its respective owners, and any references here are made solely for identification or informational purposes, without implying any affiliation, endorsement, or partnership.
We make no representations or warranties, express or implied, regarding the accuracy, completeness, or suitability of any content or products presented. Nothing on this website should be construed as legal, tax, investment, financial, medical, or other professional advice. In addition, no part of this site—including articles or product references—constitutes a solicitation, recommendation, endorsement, advertisement, or offer to buy or sell any securities, franchises, or other financial instruments, particularly in jurisdictions where such activity would be unlawful.
All content is of a general nature and may not address the specific circumstances of any individual or entity. It is not a substitute for professional advice or services. Any actions you take based on the information provided here are strictly at your own risk. You accept full responsibility for any decisions or outcomes arising from your use of this website and agree to release us from any liability in connection with your use of, or reliance upon, the content or products found herein.