
|
Grupo de tecnologia em saúde vencedora Co., Ltd. (300253.SZ) Avaliação DCF |
Totalmente Editável: Adapte-Se Às Suas Necessidades No Excel Ou Planilhas
Design Profissional: Modelos Confiáveis E Padrão Da Indústria
Pré-Construídos Para Uso Rápido E Eficiente
Compatível com MAC/PC, totalmente desbloqueado
Não É Necessária Experiência; Fácil De Seguir
Winning Health Technology Group Co., Ltd. (300253.SZ) Bundle
Aprimore suas opções de investimento com o Grupo de Tecnologia da Saúde vencedora Co., Ltd. DCF Calculator! Explore dados financeiros autênticos, ajuste as projeções e despesas de crescimento e observe como essas modificações afetam o valor intrínseco de (300253SZ) em tempo real.
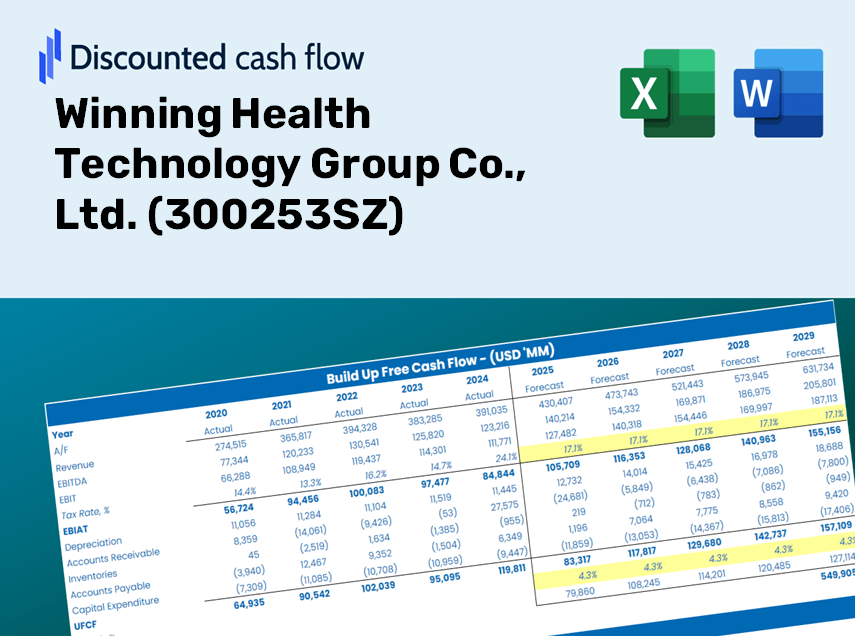
Discounted Cash Flow (DCF) - (USD MM)
| Year | AY1 2020 |
AY2 2021 |
AY3 2022 |
AY4 2023 |
AY5 2024 |
FY1 2025 |
FY2 2026 |
FY3 2027 |
FY4 2028 |
FY5 2029 |
|---|---|---|---|---|---|---|---|---|---|---|
| Revenue | 2,266.6 | 2,750.2 | 3,092.9 | 3,163.4 | 2,782.2 | 2,949.4 | 3,126.5 | 3,314.4 | 3,513.5 | 3,724.5 |
| Revenue Growth, % | 0 | 21.34 | 12.46 | 2.28 | -12.05 | 6.01 | 6.01 | 6.01 | 6.01 | 6.01 |
| EBITDA | 495.7 | 299.2 | 90.9 | 417.1 | 293.2 | 350.4 | 371.5 | 393.8 | 417.5 | 442.5 |
| EBITDA, % | 21.87 | 10.88 | 2.94 | 13.18 | 10.54 | 11.88 | 11.88 | 11.88 | 11.88 | 11.88 |
| Depreciation | 18.5 | 19.9 | 21.4 | 21.8 | 22.9 | 22.1 | 23.4 | 24.8 | 26.3 | 27.9 |
| Depreciation, % | 0.81701 | 0.72221 | 0.69039 | 0.68819 | 0.8236 | 0.74828 | 0.74828 | 0.74828 | 0.74828 | 0.74828 |
| EBIT | 477.2 | 279.3 | 69.5 | 395.3 | 270.3 | 328.4 | 348.1 | 369.0 | 391.2 | 414.7 |
| EBIT, % | 21.05 | 10.16 | 2.25 | 12.5 | 9.71 | 11.13 | 11.13 | 11.13 | 11.13 | 11.13 |
| Total Cash | 988.8 | 1,600.5 | 1,281.6 | 1,114.1 | 1,338.9 | 1,336.7 | 1,417.0 | 1,502.1 | 1,592.3 | 1,688.0 |
| Total Cash, percent | .0 | .0 | .0 | .0 | .0 | .0 | .0 | .0 | .0 | .0 |
| Account Receivables | 1,890.2 | 2,214.6 | 2,872.6 | 3,342.2 | 3,495.7 | 2,694.5 | 2,856.4 | 3,028.0 | 3,209.9 | 3,402.7 |
| Account Receivables, % | 83.39 | 80.52 | 92.88 | 105.65 | 125.64 | 91.36 | 91.36 | 91.36 | 91.36 | 91.36 |
| Inventories | 128.3 | 133.1 | 97.5 | 110.7 | 111.1 | 124.7 | 132.2 | 140.2 | 148.6 | 157.5 |
| Inventories, % | 5.66 | 4.84 | 3.15 | 3.5 | 3.99 | 4.23 | 4.23 | 4.23 | 4.23 | 4.23 |
| Accounts Payable | 394.4 | 499.3 | 603.0 | 674.7 | 697.5 | 598.4 | 634.4 | 672.5 | 712.9 | 755.7 |
| Accounts Payable, % | 17.4 | 18.15 | 19.5 | 21.33 | 25.07 | 20.29 | 20.29 | 20.29 | 20.29 | 20.29 |
| Capital Expenditure | -187.0 | -286.2 | -323.7 | -313.3 | -305.8 | -295.1 | -312.8 | -331.6 | -351.5 | -372.6 |
| Capital Expenditure, % | -8.25 | -10.41 | -10.47 | -9.9 | -10.99 | -10 | -10 | -10 | -10 | -10 |
| Tax Rate, % | -1.07 | -1.07 | -1.07 | -1.07 | -1.07 | -1.07 | -1.07 | -1.07 | -1.07 | -1.07 |
| EBITAT | 429.1 | 283.1 | 196.0 | 415.3 | 273.2 | 321.7 | 341.1 | 361.6 | 383.3 | 406.3 |
| Depreciation | ||||||||||
| Changes in Account Receivables | ||||||||||
| Changes in Inventories | ||||||||||
| Changes in Accounts Payable | ||||||||||
| Capital Expenditure | ||||||||||
| UFCF | -1,363.4 | -207.7 | -625.1 | -287.4 | -140.8 | 737.2 | -81.7 | -86.6 | -91.8 | -97.3 |
| WACC, % | 4.63 | 4.67 | 4.67 | 4.67 | 4.67 | 4.66 | 4.66 | 4.66 | 4.66 | 4.66 |
| PV UFCF | ||||||||||
| SUM PV UFCF | 400.2 | |||||||||
| Long Term Growth Rate, % | 2.00 | |||||||||
| Free cash flow (T + 1) | -99 | |||||||||
| Terminal Value | -3,734 | |||||||||
| Present Terminal Value | -2,973 | |||||||||
| Enterprise Value | -2,573 | |||||||||
| Net Debt | -230 | |||||||||
| Equity Value | -2,343 | |||||||||
| Diluted Shares Outstanding, MM | 2,160 | |||||||||
| Equity Value Per Share | -1.09 |
What You Will Receive
- Genuine Winning Health Financials: Features both historical and projected data for precise evaluation.
- Customizable Parameters: Adjust inputs like WACC, tax rates, revenue growth, and capital expenditures.
- Real-time Calculations: Intrinsic value and NPV are computed automatically.
- Scenario Analysis: Explore various scenarios to assess the future performance of Winning Health Technology Group (300253SZ).
- User-Friendly Design: Designed for professionals while remaining accessible to newcomers.
Key Features
- Real-Time Winning Health Data: Pre-loaded with historical financials and future projections for Winning Health Technology Group Co., Ltd. (300253SZ).
- Completely Customizable Parameters: Modify revenue growth rates, profit margins, discount rates, tax implications, and capital investments.
- Interactive Valuation Framework: Instant updates to Net Present Value (NPV) and intrinsic value based on your specified parameters.
- Scenario Simulation: Develop various forecasting scenarios to evaluate diverse valuation results.
- User-Centric Interface: Intuitive, organized, and crafted for both professionals and novices.
How It Functions
- Download the Template: Gain immediate access to the Excel-based Winning Health Technology DCF Calculator for [300253SZ].
- Input Your Assumptions: Modify the yellow-highlighted cells for growth rates, WACC, profit margins, and other variables.
- Instant Calculations: The model automatically recalculates the intrinsic value of Winning Health Technology.
- Test Scenarios: Experiment with various assumptions to see how they impact valuation outcomes.
- Analyze and Decide: Utilize the findings to inform your investment strategy or financial assessment.
Why Opt for This Calculator?
- User-Friendly: Crafted to cater to both novices and seasoned professionals.
- Customizable Inputs: Easily adjust parameters to suit your specific analysis needs.
- Real-Time Updates: Observe immediate changes to Winning Health Technology Group Co., Ltd.'s (300253SZ) valuation as you modify inputs.
- Pre-Configured: Comes loaded with Winning Health's relevant financial information for swift evaluations.
- Preferred by Experts: Utilized by investors and analysts for making well-informed decisions.
Who Can Benefit from Our Solutions?
- Healthcare Investors: Develop comprehensive and trustworthy valuation models for portfolio assessments related to Winning Health Technology Group Co., Ltd. (300253SZ).
- Corporate Finance Departments: Evaluate valuation scenarios to inform strategic decisions within their organizations.
- Consultants and Financial Advisors: Offer clients precise valuation insights on Winning Health Technology Group Co., Ltd. (300253SZ).
- Students and Academic Professionals: Utilize real-world data to enhance financial modeling skills in a classroom or research setting.
- Tech Enthusiasts: Gain insights into how companies like Winning Health Technology Group Co., Ltd. (300253SZ) are valued in the technology market.
Contents of the Winning Health Technology Template
- In-Depth DCF Model: A customizable template equipped with comprehensive valuation calculations.
- Actual Financial Data: Winning Health Technology’s (300253SZ) historical and projected financial figures integrated for thorough analysis.
- Adjustable Assumptions: Modify WACC, growth rates, and tax parameters to evaluate different scenarios.
- Detailed Financial Statements: Complete annual and quarterly breakdowns to provide deeper insights.
- Essential Ratios: Integrated analysis for profitability, efficiency, and leverage metrics.
- Visual Dashboard Outputs: Charts and tables designed for clear and actionable insights.
Disclaimer
All information, articles, and product details provided on this website are for general informational and educational purposes only. We do not claim any ownership over, nor do we intend to infringe upon, any trademarks, copyrights, logos, brand names, or other intellectual property mentioned or depicted on this site. Such intellectual property remains the property of its respective owners, and any references here are made solely for identification or informational purposes, without implying any affiliation, endorsement, or partnership.
We make no representations or warranties, express or implied, regarding the accuracy, completeness, or suitability of any content or products presented. Nothing on this website should be construed as legal, tax, investment, financial, medical, or other professional advice. In addition, no part of this site—including articles or product references—constitutes a solicitation, recommendation, endorsement, advertisement, or offer to buy or sell any securities, franchises, or other financial instruments, particularly in jurisdictions where such activity would be unlawful.
All content is of a general nature and may not address the specific circumstances of any individual or entity. It is not a substitute for professional advice or services. Any actions you take based on the information provided here are strictly at your own risk. You accept full responsibility for any decisions or outcomes arising from your use of this website and agree to release us from any liability in connection with your use of, or reliance upon, the content or products found herein.