
|
Kunshan Kinglai Hygienic Materials Co., Ltd. (300260.sz) Avaliação DCF |
Totalmente Editável: Adapte-Se Às Suas Necessidades No Excel Ou Planilhas
Design Profissional: Modelos Confiáveis E Padrão Da Indústria
Pré-Construídos Para Uso Rápido E Eficiente
Compatível com MAC/PC, totalmente desbloqueado
Não É Necessária Experiência; Fácil De Seguir
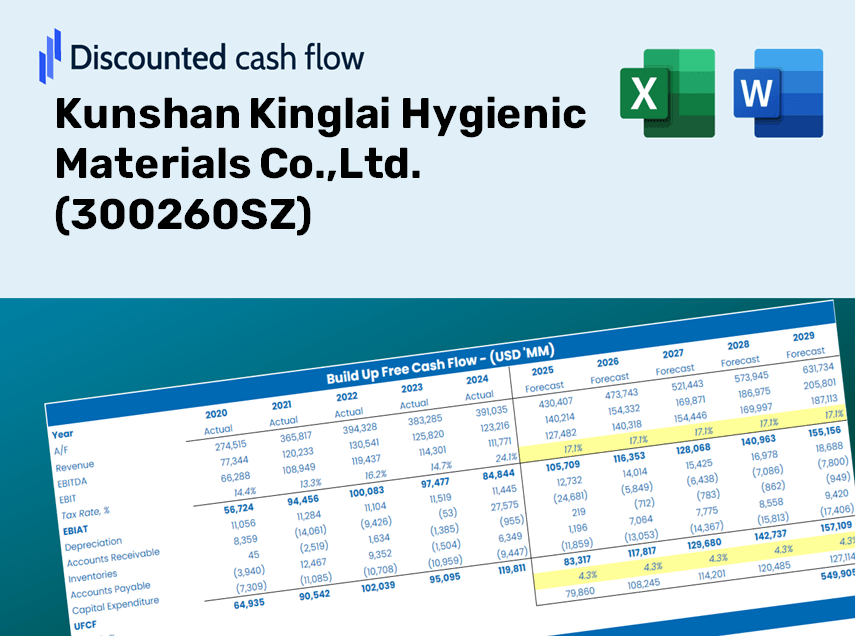
Kunshan Kinglai Hygienic Materials Co.,Ltd. (300260.SZ) Bundle
Avalie as perspectivas financeiras da Kunshan Kinglai Hygienic Materials Co., Ltd. Como um especialista! Esta calculadora DCF (300260SZ) fornece dados financeiros pré-preenchidos e permite a flexibilidade de modificar o crescimento da receita, o WACC, as margens e outras suposições essenciais para se alinhar às suas projeções.
Discounted Cash Flow (DCF) - (USD MM)
| Year | AY1 2020 |
AY2 2021 |
AY3 2022 |
AY4 2023 |
AY5 2024 |
FY1 2025 |
FY2 2026 |
FY3 2027 |
FY4 2028 |
FY5 2029 |
|---|---|---|---|---|---|---|---|---|---|---|
| Revenue | 1,323.0 | 2,054.4 | 2,620.1 | 2,711.4 | 2,849.0 | 3,499.8 | 4,299.3 | 5,281.4 | 6,487.9 | 7,969.9 |
| Revenue Growth, % | 0 | 55.28 | 27.53 | 3.49 | 5.08 | 22.84 | 22.84 | 22.84 | 22.84 | 22.84 |
| EBITDA | 189.2 | 302.8 | 539.3 | 413.3 | 433.5 | 560.5 | 688.6 | 845.9 | 1,039.1 | 1,276.5 |
| EBITDA, % | 14.3 | 14.74 | 20.58 | 15.24 | 15.22 | 16.02 | 16.02 | 16.02 | 16.02 | 16.02 |
| Depreciation | 76.1 | 84.9 | 103.7 | 121.4 | 129.2 | 160.0 | 196.5 | 241.4 | 296.6 | 364.3 |
| Depreciation, % | 5.75 | 4.13 | 3.96 | 4.48 | 4.54 | 4.57 | 4.57 | 4.57 | 4.57 | 4.57 |
| EBIT | 113.1 | 217.9 | 435.6 | 291.8 | 304.3 | 400.6 | 492.1 | 604.5 | 742.5 | 912.2 |
| EBIT, % | 8.55 | 10.61 | 16.63 | 10.76 | 10.68 | 11.44 | 11.44 | 11.44 | 11.44 | 11.44 |
| Total Cash | 269.2 | 260.1 | 247.4 | 296.2 | 533.5 | 504.7 | 620.0 | 761.6 | 935.6 | 1,149.3 |
| Total Cash, percent | .0 | .0 | .0 | .0 | .0 | .0 | .0 | .0 | .0 | .0 |
| Account Receivables | 423.7 | 539.4 | 690.8 | 834.6 | 937.5 | 1,038.3 | 1,275.5 | 1,566.8 | 1,924.8 | 2,364.4 |
| Account Receivables, % | 32.03 | 26.26 | 26.36 | 30.78 | 32.91 | 29.67 | 29.67 | 29.67 | 29.67 | 29.67 |
| Inventories | 765.8 | 1,033.4 | 1,409.4 | 1,583.1 | 1,548.7 | 1,922.9 | 2,362.2 | 2,901.8 | 3,564.7 | 4,379.0 |
| Inventories, % | 57.88 | 50.3 | 53.79 | 58.39 | 54.36 | 54.94 | 54.94 | 54.94 | 54.94 | 54.94 |
| Accounts Payable | 325.1 | 495.3 | 658.3 | 776.1 | 895.1 | 936.9 | 1,150.9 | 1,413.8 | 1,736.8 | 2,133.6 |
| Accounts Payable, % | 24.57 | 24.11 | 25.13 | 28.62 | 31.42 | 26.77 | 26.77 | 26.77 | 26.77 | 26.77 |
| Capital Expenditure | -94.4 | -151.1 | -226.5 | -439.3 | -310.4 | -351.6 | -431.9 | -530.6 | -651.8 | -800.6 |
| Capital Expenditure, % | -7.13 | -7.35 | -8.65 | -16.2 | -10.9 | -10.05 | -10.05 | -10.05 | -10.05 | -10.05 |
| Tax Rate, % | 13.41 | 13.41 | 13.41 | 13.41 | 13.41 | 13.41 | 13.41 | 13.41 | 13.41 | 13.41 |
| EBITAT | 105.4 | 187.3 | 380.1 | 262.6 | 263.5 | 354.9 | 436.0 | 535.6 | 657.9 | 808.2 |
| Depreciation | ||||||||||
| Changes in Account Receivables | ||||||||||
| Changes in Inventories | ||||||||||
| Changes in Accounts Payable | ||||||||||
| Capital Expenditure | ||||||||||
| UFCF | -777.2 | -91.9 | -107.1 | -255.0 | 132.8 | -269.9 | -261.8 | -321.6 | -395.0 | -485.3 |
| WACC, % | 4.47 | 4.46 | 4.46 | 4.46 | 4.46 | 4.46 | 4.46 | 4.46 | 4.46 | 4.46 |
| PV UFCF | ||||||||||
| SUM PV UFCF | -1,502.2 | |||||||||
| Long Term Growth Rate, % | 4.00 | |||||||||
| Free cash flow (T + 1) | -505 | |||||||||
| Terminal Value | -109,339 | |||||||||
| Present Terminal Value | -87,900 | |||||||||
| Enterprise Value | -89,403 | |||||||||
| Net Debt | 837 | |||||||||
| Equity Value | -90,240 | |||||||||
| Diluted Shares Outstanding, MM | 404 | |||||||||
| Equity Value Per Share | -223.26 |
What You Will Receive
- Customizable Excel Template: A fully adaptable Excel-based DCF Calculator featuring pre-populated financial data for Kunshan Kinglai Hygienic Materials Co., Ltd. (300260SZ).
- Accurate Market Data: Historical performance data and forward-looking projections (detailed in the highlighted cells).
- Adjustable Forecasts: Modify key assumptions such as revenue growth, EBITDA margins, and WACC.
- Real-Time Calculations: Instantly observe how your inputs affect the valuation of Kunshan Kinglai Hygienic Materials Co., Ltd. (300260SZ).
- Professional Grade Tool: Designed for use by investors, CFOs, consultants, and financial analysts.
- Intuitive Layout: Organized for straightforward navigation and usability, complete with step-by-step guidance.
Key Features
- Comprehensive DCF Calculator: Features robust unlevered and levered DCF valuation models for accurate analysis.
- WACC Calculator: Comes with a pre-configured Weighted Average Cost of Capital worksheet, allowing for personalized input parameters.
- Customizable Forecast Assumptions: Easily adjust growth projections, capital expenditures, and discount rates.
- Integrated Financial Ratios: Evaluate profitability, leverage, and efficiency metrics specifically for Kunshan Kinglai Hygienic Materials Co., Ltd. (300260SZ).
- Dashboard and Visualizations: Generates visual representations that highlight essential valuation metrics for streamlined analysis.
How It Works
- 1. Access the Template: Download and open the Excel file containing Kunshan Kinglai Hygienic Materials Co.,Ltd.'s [300260SZ] preloaded data.
- 2. Modify Assumptions: Adjust key variables such as growth rates, WACC, and capital expenditures.
- 3. View Instant Results: The DCF model automatically computes intrinsic value and NPV in real time.
- 4. Analyze Scenarios: Evaluate multiple forecasts to explore various valuation possibilities.
- 5. Present with Assurance: Deliver professional valuation insights to enhance your strategic decisions.
Why Opt for This Calculator?
- User-Friendly and Accessible: Tailored for both novices and seasoned professionals.
- Customizable Inputs: Easily adjust parameters to suit your analysis needs.
- Real-Time Updates: Watch as Kunshan Kinglai Hygienic Materials Co., Ltd.'s ([300260SZ]) valuation changes instantly with input modifications.
- Pre-Configured: Comes with Kunshan Kinglai's real financial data for rapid assessments.
- Relied Upon by Experts: A trusted tool among investors and analysts for informed decision-making.
Who Should Use This Product?
- Individual Investors: Gain insights for making informed decisions about buying or selling shares of Kunshan Kinglai Hygienic Materials Co.,Ltd. (300260SZ).
- Financial Analysts: Enhance your valuation processes with accessible financial models tailored for Kunshan Kinglai Hygienic Materials Co.,Ltd. (300260SZ).
- Consultants: Provide accurate and timely valuation insights for your clients regarding Kunshan Kinglai Hygienic Materials Co.,Ltd. (300260SZ).
- Business Owners: Learn how leading companies like Kunshan Kinglai Hygienic Materials Co.,Ltd. (300260SZ) are valued to inform your own business strategies.
- Finance Students: Explore real-world data and scenarios to master valuation techniques related to Kunshan Kinglai Hygienic Materials Co.,Ltd. (300260SZ).
Contents of the Template
- Preloaded KKL Data: Historical and anticipated financial metrics, including revenue, EBIT, and capital expenditures.
- DCF and WACC Models: Advanced worksheets for determining intrinsic value and Weighted Average Cost of Capital.
- Editable Inputs: Yellow-highlighted fields for modifying revenue growth estimates, tax rates, and discount rates.
- Financial Statements: Detailed annual and quarterly financial reports for enhanced analysis.
- Key Ratios: Metrics for profitability, leverage, and efficiency to assess business performance.
- Dashboard and Charts: Visual representations of valuation results and key assumptions.
Disclaimer
All information, articles, and product details provided on this website are for general informational and educational purposes only. We do not claim any ownership over, nor do we intend to infringe upon, any trademarks, copyrights, logos, brand names, or other intellectual property mentioned or depicted on this site. Such intellectual property remains the property of its respective owners, and any references here are made solely for identification or informational purposes, without implying any affiliation, endorsement, or partnership.
We make no representations or warranties, express or implied, regarding the accuracy, completeness, or suitability of any content or products presented. Nothing on this website should be construed as legal, tax, investment, financial, medical, or other professional advice. In addition, no part of this site—including articles or product references—constitutes a solicitation, recommendation, endorsement, advertisement, or offer to buy or sell any securities, franchises, or other financial instruments, particularly in jurisdictions where such activity would be unlawful.
All content is of a general nature and may not address the specific circumstances of any individual or entity. It is not a substitute for professional advice or services. Any actions you take based on the information provided here are strictly at your own risk. You accept full responsibility for any decisions or outcomes arising from your use of this website and agree to release us from any liability in connection with your use of, or reliance upon, the content or products found herein.