
|
Sanfeng Intelligent Equipment Group Co., Ltd. (300276.sz) Avaliação DCF |
Totalmente Editável: Adapte-Se Às Suas Necessidades No Excel Ou Planilhas
Design Profissional: Modelos Confiáveis E Padrão Da Indústria
Pré-Construídos Para Uso Rápido E Eficiente
Compatível com MAC/PC, totalmente desbloqueado
Não É Necessária Experiência; Fácil De Seguir
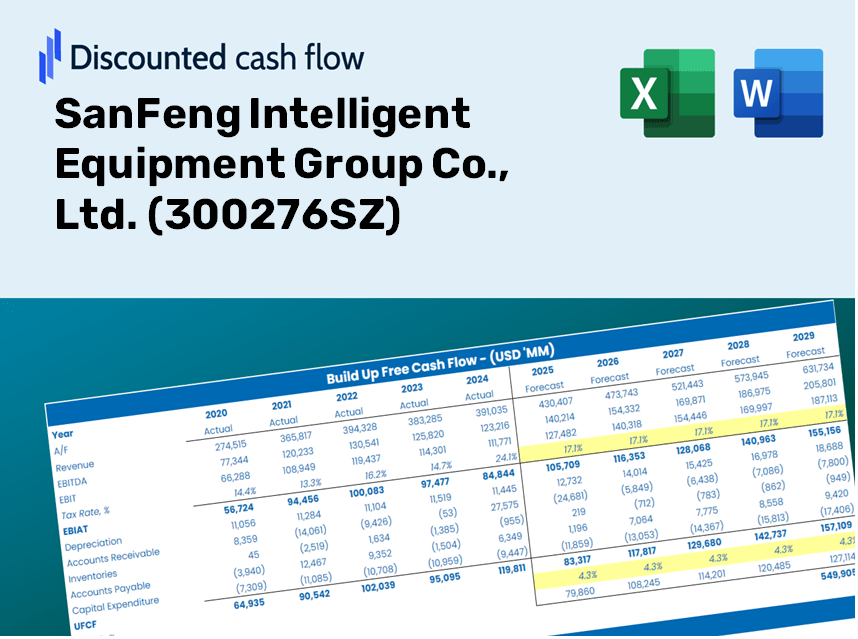
SanFeng Intelligent Equipment Group Co., Ltd. (300276.SZ) Bundle
Aprimore suas estratégias de investimento com a calculadora DCF (300276SZ)! Utilize dados financeiros genuínos da Sanfeng, ajuste as projeções e despesas de crescimento e observe instantaneamente como essas mudanças afetam o valor intrínseco da Sanfeng Intelligent Equipment Group Co., Ltd.
Discounted Cash Flow (DCF) - (USD MM)
| Year | AY1 2020 |
AY2 2021 |
AY3 2022 |
AY4 2023 |
AY5 2024 |
FY1 2025 |
FY2 2026 |
FY3 2027 |
FY4 2028 |
FY5 2029 |
|---|---|---|---|---|---|---|---|---|---|---|
| Revenue | 1,167.9 | 1,426.6 | 1,333.7 | 1,722.5 | 1,937.7 | 2,215.1 | 2,532.3 | 2,895.0 | 3,309.5 | 3,783.5 |
| Revenue Growth, % | 0 | 22.15 | -6.51 | 29.15 | 12.49 | 14.32 | 14.32 | 14.32 | 14.32 | 14.32 |
| EBITDA | -1,271.2 | 163.6 | -456.1 | 73.8 | 81.1 | -506.2 | -578.7 | -661.6 | -756.3 | -864.6 |
| EBITDA, % | -108.84 | 11.47 | -34.2 | 4.29 | 4.18 | -22.85 | -22.85 | -22.85 | -22.85 | -22.85 |
| Depreciation | 45.2 | 44.0 | 42.6 | 43.4 | 45.5 | 66.5 | 76.1 | 87.0 | 99.4 | 113.6 |
| Depreciation, % | 3.87 | 3.09 | 3.19 | 2.52 | 2.35 | 3 | 3 | 3 | 3 | 3 |
| EBIT | -1,316.4 | 119.6 | -498.7 | 30.4 | 35.6 | -555.6 | -635.2 | -726.1 | -830.1 | -949.0 |
| EBIT, % | -112.71 | 8.38 | -37.39 | 1.77 | 1.84 | -25.08 | -25.08 | -25.08 | -25.08 | -25.08 |
| Total Cash | 462.4 | 361.3 | 457.8 | 445.9 | 260.9 | 614.0 | 701.9 | 802.4 | 917.3 | 1,048.7 |
| Total Cash, percent | .0 | .0 | .0 | .0 | .0 | .0 | .0 | .0 | .0 | .0 |
| Account Receivables | 769.2 | 849.4 | 664.7 | 821.4 | 859.9 | 1,184.3 | 1,353.8 | 1,547.7 | 1,769.3 | 2,022.7 |
| Account Receivables, % | 65.86 | 59.54 | 49.84 | 47.69 | 44.38 | 53.46 | 53.46 | 53.46 | 53.46 | 53.46 |
| Inventories | 1,264.3 | 1,291.5 | 1,691.2 | 2,561.7 | 2,263.4 | 2,173.2 | 2,484.4 | 2,840.1 | 3,246.8 | 3,711.8 |
| Inventories, % | 108.25 | 90.53 | 126.81 | 148.72 | 116.81 | 98.11 | 98.11 | 98.11 | 98.11 | 98.11 |
| Accounts Payable | 421.0 | 422.5 | 640.3 | 772.4 | 627.1 | 845.7 | 966.8 | 1,105.2 | 1,263.5 | 1,444.4 |
| Accounts Payable, % | 36.05 | 29.62 | 48.01 | 44.84 | 32.36 | 38.18 | 38.18 | 38.18 | 38.18 | 38.18 |
| Capital Expenditure | -24.4 | -38.5 | -24.7 | -7.5 | -15.7 | -34.9 | -39.9 | -45.6 | -52.2 | -59.6 |
| Capital Expenditure, % | -2.09 | -2.7 | -1.85 | -0.43251 | -0.81154 | -1.58 | -1.58 | -1.58 | -1.58 | -1.58 |
| Tax Rate, % | 5.83 | 5.83 | 5.83 | 5.83 | 5.83 | 5.83 | 5.83 | 5.83 | 5.83 | 5.83 |
| EBITAT | -1,303.5 | 108.9 | -495.7 | 26.4 | 33.5 | -522.6 | -597.5 | -683.0 | -780.9 | -892.7 |
| Depreciation | ||||||||||
| Changes in Account Receivables | ||||||||||
| Changes in Inventories | ||||||||||
| Changes in Accounts Payable | ||||||||||
| Capital Expenditure | ||||||||||
| UFCF | -2,895.2 | 8.6 | -475.0 | -832.7 | 177.8 | -506.6 | -921.0 | -1,052.9 | -1,203.7 | -1,376.1 |
| WACC, % | 4.66 | 4.65 | 4.66 | 4.65 | 4.65 | 4.65 | 4.65 | 4.65 | 4.65 | 4.65 |
| PV UFCF | ||||||||||
| SUM PV UFCF | -4,343.1 | |||||||||
| Long Term Growth Rate, % | 2.00 | |||||||||
| Free cash flow (T + 1) | -1,404 | |||||||||
| Terminal Value | -52,876 | |||||||||
| Present Terminal Value | -42,118 | |||||||||
| Enterprise Value | -46,461 | |||||||||
| Net Debt | -140 | |||||||||
| Equity Value | -46,321 | |||||||||
| Diluted Shares Outstanding, MM | 1,398 | |||||||||
| Equity Value Per Share | -33.14 |
Benefits You Will Receive
- Genuine SanFeng (300276SZ) Financial Data: Offers both historical and projected figures for precise valuation assessments.
- Customizable Inputs: Adjust WACC, tax rates, revenue growth, and capital expenditures as needed.
- Automated Calculations: Key metrics like intrinsic value and NPV are computed in real-time.
- Scenario Testing: Evaluate various scenarios to analyze the future growth of SanFeng.
- User-Friendly Design: Designed for industry professionals while remaining approachable for newcomers.
Key Features
- Pre-Loaded Data: Historical financial statements and pre-filled forecasts for SanFeng Intelligent Equipment Group Co., Ltd. (300276SZ).
- Fully Adjustable Inputs: Modify WACC, tax rates, revenue growth, and EBITDA margins to suit your analysis.
- Instant Results: Obtain real-time recalculations of SanFeng's intrinsic value.
- Clear Visual Outputs: Dashboard charts provide a clear view of valuation results and essential metrics.
- Built for Accuracy: A reliable tool designed for analysts, investors, and financial professionals.
How It Operates
- Step 1: Download the Excel spreadsheet.
- Step 2: Examine SanFeng Intelligent Equipment Group Co., Ltd.'s pre-filled financial metrics and projections.
- Step 3: Adjust key inputs such as revenue growth, WACC, and tax rates (highlighted cells).
- Step 4: Observe the DCF model refresh in real time as you modify your assumptions.
- Step 5: Review the outputs and leverage the findings for your investment strategies.
Why Choose This Calculator for SanFeng Intelligent Equipment Group Co., Ltd. (300276SZ)?
- Reliable Data: Use authentic SanFeng financial figures for trustworthy valuation outcomes.
- Fully Customizable: Tailor essential metrics such as growth rates, WACC, and tax rates to fit your forecasts.
- Time Efficiency: Ready-made calculations save you from starting from ground zero.
- Professional-Quality Tool: Created specifically for investors, analysts, and industry consultants.
- User-Friendly Design: Easy-to-navigate interface and clear instructions cater to all user levels.
Who Can Benefit from This Product?
- Engineering Students: Master advanced equipment technologies and apply theoretical concepts with practical examples.
- Researchers: Utilize industry-leading models in your studies and publications related to automation and intelligent equipment.
- Investors: Evaluate your investment strategies and assess valuation trends for SanFeng Intelligent Equipment Group Co., Ltd. (300276SZ).
- Industry Analysts: Enhance your analysis with a custom, ready-to-use financial model tailored for intelligent equipment sectors.
- Manufacturing Entrepreneurs: Discover how large corporations like SanFeng approach operational efficiency and market analysis.
Contents of the Template
- Preloaded SFIEG Data: Historical and projected financial metrics, including revenue, EBIT, and capital expenditures.
- DCF and WACC Models: Advanced templates for determining intrinsic value and Weighted Average Cost of Capital.
- Editable Inputs: Cells marked in yellow for modifying revenue growth, tax rates, and discount rates.
- Financial Statements: Detailed annual and quarterly financial reports for in-depth assessment.
- Key Ratios: Ratios for profitability, leverage, and efficiency to analyze performance.
- Dashboard and Charts: Visual representations of valuation results and key assumptions.
Disclaimer
All information, articles, and product details provided on this website are for general informational and educational purposes only. We do not claim any ownership over, nor do we intend to infringe upon, any trademarks, copyrights, logos, brand names, or other intellectual property mentioned or depicted on this site. Such intellectual property remains the property of its respective owners, and any references here are made solely for identification or informational purposes, without implying any affiliation, endorsement, or partnership.
We make no representations or warranties, express or implied, regarding the accuracy, completeness, or suitability of any content or products presented. Nothing on this website should be construed as legal, tax, investment, financial, medical, or other professional advice. In addition, no part of this site—including articles or product references—constitutes a solicitation, recommendation, endorsement, advertisement, or offer to buy or sell any securities, franchises, or other financial instruments, particularly in jurisdictions where such activity would be unlawful.
All content is of a general nature and may not address the specific circumstances of any individual or entity. It is not a substitute for professional advice or services. Any actions you take based on the information provided here are strictly at your own risk. You accept full responsibility for any decisions or outcomes arising from your use of this website and agree to release us from any liability in connection with your use of, or reliance upon, the content or products found herein.