
|
Yinbang Clad Material Co., Ltd (300337.sz) Avaliação DCF |
Totalmente Editável: Adapte-Se Às Suas Necessidades No Excel Ou Planilhas
Design Profissional: Modelos Confiáveis E Padrão Da Indústria
Pré-Construídos Para Uso Rápido E Eficiente
Compatível com MAC/PC, totalmente desbloqueado
Não É Necessária Experiência; Fácil De Seguir
Yinbang Clad Material Co.,Ltd (300337.SZ) Bundle
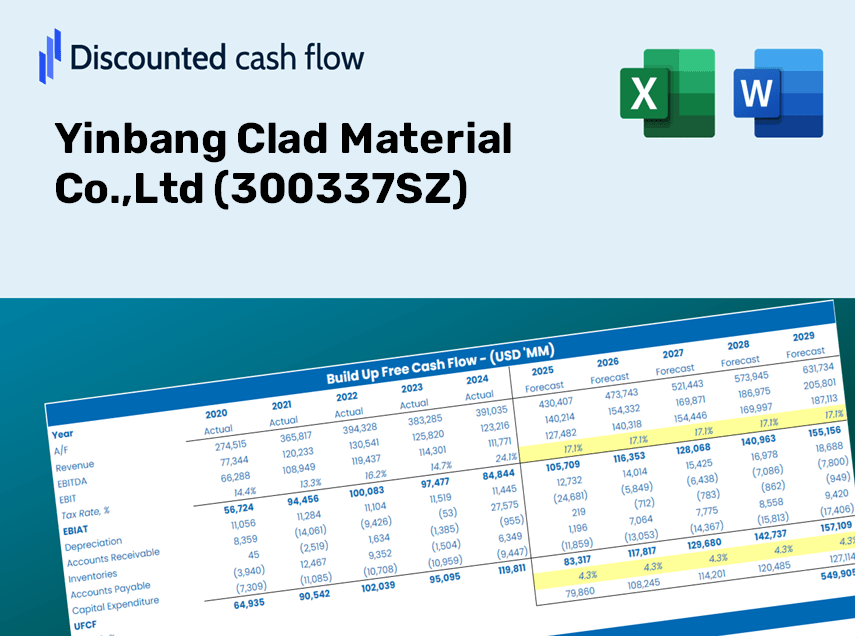
Simplifique a Avaliação Yinbang Clad Material Co., Ltd (300337SZ) com esta calculadora DCF personalizável! Apresentando o Yinbang Clad Material Co., Ltd (300337SZ) e entradas de previsão ajustáveis, você pode testar cenários e descobrir o valor justo Yinbang Clad Material Co., Ltd (300337SZ) em minutos.
Discounted Cash Flow (DCF) - (USD MM)
| Year | AY1 2020 |
AY2 2021 |
AY3 2022 |
AY4 2023 |
AY5 2024 |
FY1 2025 |
FY2 2026 |
FY3 2027 |
FY4 2028 |
FY5 2029 |
|---|---|---|---|---|---|---|---|---|---|---|
| Revenue | 2,370.5 | 3,195.3 | 3,944.3 | 4,456.6 | 5,352.2 | 6,574.1 | 8,074.9 | 9,918.4 | 12,182.8 | 14,964.1 |
| Revenue Growth, % | 0 | 34.79 | 23.44 | 12.99 | 20.1 | 22.83 | 22.83 | 22.83 | 22.83 | 22.83 |
| EBITDA | 220.9 | 251.9 | 245.8 | 275.6 | 304.4 | 464.2 | 570.2 | 700.4 | 860.3 | 1,056.7 |
| EBITDA, % | 9.32 | 7.88 | 6.23 | 6.18 | 5.69 | 7.06 | 7.06 | 7.06 | 7.06 | 7.06 |
| Depreciation | 128.0 | 121.5 | 115.5 | 118.5 | 123.0 | 224.7 | 276.0 | 339.0 | 416.3 | 511.4 |
| Depreciation, % | 5.4 | 3.8 | 2.93 | 2.66 | 2.3 | 3.42 | 3.42 | 3.42 | 3.42 | 3.42 |
| EBIT | 92.9 | 130.4 | 130.3 | 157.2 | 181.5 | 239.6 | 294.3 | 361.4 | 443.9 | 545.3 |
| EBIT, % | 3.92 | 4.08 | 3.3 | 3.53 | 3.39 | 3.64 | 3.64 | 3.64 | 3.64 | 3.64 |
| Total Cash | 331.6 | 587.0 | 896.5 | 575.6 | 419.1 | 997.1 | 1,224.7 | 1,504.3 | 1,847.8 | 2,269.6 |
| Total Cash, percent | .0 | .0 | .0 | .0 | .0 | .0 | .0 | .0 | .0 | .0 |
| Account Receivables | 817.5 | 864.1 | 892.3 | 860.2 | 1,262.7 | 1,670.4 | 2,051.8 | 2,520.2 | 3,095.5 | 3,802.3 |
| Account Receivables, % | 34.49 | 27.04 | 22.62 | 19.3 | 23.59 | 25.41 | 25.41 | 25.41 | 25.41 | 25.41 |
| Inventories | 608.4 | 748.2 | 796.6 | 1,005.1 | 1,589.8 | 1,597.9 | 1,962.7 | 2,410.8 | 2,961.2 | 3,637.3 |
| Inventories, % | 25.67 | 23.41 | 20.2 | 22.55 | 29.7 | 24.31 | 24.31 | 24.31 | 24.31 | 24.31 |
| Accounts Payable | 296.8 | 303.6 | 334.2 | 304.7 | 656.0 | 652.0 | 800.9 | 983.7 | 1,208.3 | 1,484.1 |
| Accounts Payable, % | 12.52 | 9.5 | 8.47 | 6.84 | 12.26 | 9.92 | 9.92 | 9.92 | 9.92 | 9.92 |
| Capital Expenditure | -92.6 | -31.4 | -64.0 | -699.2 | -467.1 | -406.7 | -499.5 | -613.6 | -753.6 | -925.7 |
| Capital Expenditure, % | -3.91 | -0.98241 | -1.62 | -15.69 | -8.73 | -6.19 | -6.19 | -6.19 | -6.19 | -6.19 |
| Tax Rate, % | 12.39 | 12.39 | 12.39 | 12.39 | 12.39 | 12.39 | 12.39 | 12.39 | 12.39 | 12.39 |
| EBITAT | 71.8 | 130.8 | 132.3 | 167.6 | 159.0 | 222.7 | 273.6 | 336.0 | 412.7 | 506.9 |
| Depreciation | ||||||||||
| Changes in Account Receivables | ||||||||||
| Changes in Inventories | ||||||||||
| Changes in Accounts Payable | ||||||||||
| Capital Expenditure | ||||||||||
| UFCF | -1,022.0 | 41.4 | 137.9 | -619.1 | -821.0 | -379.2 | -547.3 | -672.3 | -825.8 | -1,014.3 |
| WACC, % | 4.09 | 4.32 | 4.32 | 4.32 | 4.2 | 4.25 | 4.25 | 4.25 | 4.25 | 4.25 |
| PV UFCF | ||||||||||
| SUM PV UFCF | -2,983.4 | |||||||||
| Long Term Growth Rate, % | 3.50 | |||||||||
| Free cash flow (T + 1) | -1,050 | |||||||||
| Terminal Value | -139,752 | |||||||||
| Present Terminal Value | -113,489 | |||||||||
| Enterprise Value | -116,472 | |||||||||
| Net Debt | 2,629 | |||||||||
| Equity Value | -119,101 | |||||||||
| Diluted Shares Outstanding, MM | 822 | |||||||||
| Equity Value Per Share | -144.93 |
What You Will Receive
- Authentic Yinbang Clad Data: Comprehensive financials – from revenue to EBIT – derived from actual and forecasted figures.
- Complete Customization: Modify all essential parameters (yellow cells) including WACC, growth %, and tax rates.
- Instant Valuation Adjustments: Automatic recalculations to assess the effects of changes on Yinbang Clad's fair value.
- Flexible Excel Template: Designed for quick modifications, scenario analyses, and detailed forecasts.
- Efficient and Precise: Eliminate the need to build models from scratch while ensuring accuracy and adaptability.
Key Features
- Customizable Forecast Inputs: Adjust essential metrics such as revenue growth, EBITDA percentage, and capital expenditures.
- Instant DCF Valuation: Automatically computes intrinsic value, NPV, and various financial metrics.
- High-Precision Accuracy: Leverages Yinbang Clad Material Co., Ltd's (300337SZ) actual financials for realistic valuation projections.
- Simplified Scenario Analysis: Effortlessly evaluate various assumptions and analyze different outcomes.
- Efficient Valuation Tool: Streamline your process by avoiding the construction of intricate valuation models from the ground up.
How It Functions
- Download: Obtain the comprehensive Excel file featuring Yinbang Clad Material Co., Ltd's (300337SZ) financial data.
- Customize: Modify projections, including revenue growth, EBITDA %, and WACC.
- Update Automatically: Watch the intrinsic value and NPV calculations refresh in real-time.
- Test Scenarios: Develop various projections and instantly compare their results.
- Make Decisions: Utilize the valuation outcomes to inform your investment strategy.
Why Choose Yinbang Clad Material Co., Ltd (300337SZ)?
- Precision: Rely on verified financials for unmatched data integrity.
- Versatility: Tailor inputs effortlessly to meet your specific needs.
- Efficiency: Eliminate the complexities of creating a financial model from the ground up.
- Expert-Level: Crafted with the expertise and accuracy expected by top financial professionals.
- Accessible: Intuitive design makes it simple for users of all experience levels to navigate.
Who Can Benefit from Yinbang Clad Material Co., Ltd (300337SZ)?
- Material Science Students: Explore advanced materials and their applications through practical examples.
- Researchers: Integrate industry-specific models into your studies and publications.
- Investors: Validate your investment strategies and evaluate the performance of Yinbang Clad Material Co., Ltd (300337SZ).
- Industry Analysts: Enhance efficiency with a customizable financial model tailored for material companies.
- Entrepreneurs: Understand the analysis techniques used for large public firms like Yinbang Clad Material Co., Ltd (300337SZ).
Contents of the Template
- Pre-Filled DCF Model: Financial data for Yinbang Clad Material Co., Ltd (300337SZ) preloaded for immediate application.
- WACC Calculator: Comprehensive calculations for the Weighted Average Cost of Capital.
- Financial Ratios: Assess Yinbang's profitability, leverage, and operational efficiency.
- Editable Inputs: Modify assumptions like growth rates, margins, and CAPEX to tailor scenarios to your needs.
- Financial Statements: Access annual and quarterly reports for thorough analysis.
- Interactive Dashboard: Effortlessly visualize essential valuation metrics and outcomes.
Disclaimer
All information, articles, and product details provided on this website are for general informational and educational purposes only. We do not claim any ownership over, nor do we intend to infringe upon, any trademarks, copyrights, logos, brand names, or other intellectual property mentioned or depicted on this site. Such intellectual property remains the property of its respective owners, and any references here are made solely for identification or informational purposes, without implying any affiliation, endorsement, or partnership.
We make no representations or warranties, express or implied, regarding the accuracy, completeness, or suitability of any content or products presented. Nothing on this website should be construed as legal, tax, investment, financial, medical, or other professional advice. In addition, no part of this site—including articles or product references—constitutes a solicitation, recommendation, endorsement, advertisement, or offer to buy or sell any securities, franchises, or other financial instruments, particularly in jurisdictions where such activity would be unlawful.
All content is of a general nature and may not address the specific circumstances of any individual or entity. It is not a substitute for professional advice or services. Any actions you take based on the information provided here are strictly at your own risk. You accept full responsibility for any decisions or outcomes arising from your use of this website and agree to release us from any liability in connection with your use of, or reliance upon, the content or products found herein.