
|
Changshu Tianyin Electromechanical Co., Ltd (300342.sz) Avaliação DCF |
Totalmente Editável: Adapte-Se Às Suas Necessidades No Excel Ou Planilhas
Design Profissional: Modelos Confiáveis E Padrão Da Indústria
Pré-Construídos Para Uso Rápido E Eficiente
Compatível com MAC/PC, totalmente desbloqueado
Não É Necessária Experiência; Fácil De Seguir
Changshu Tianyin Electromechanical Co.,Ltd (300342.SZ) Bundle
Ganhe informações sobre sua análise de avaliação Changshu Tianyin Electromechanical Co., Ltd (300342SZ) usando nossa sofisticada calculadora DCF! Pré -carregado com dados autênticos (300342SZ), este modelo do Excel permite ajustar as previsões e suposições para determinar com precisão o valor intrínseco da Changshu Tianyin Electromechanical Co., Ltd.
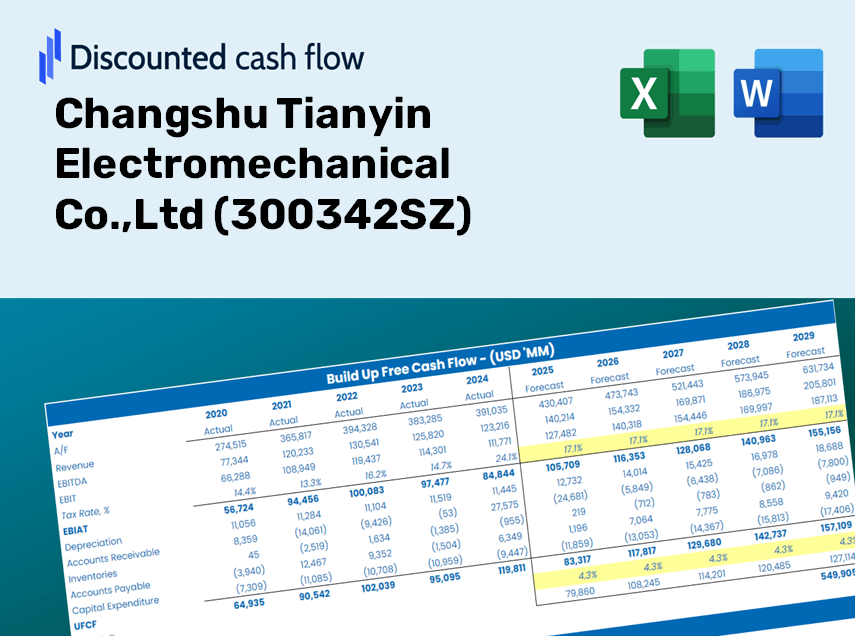
Discounted Cash Flow (DCF) - (USD MM)
| Year | AY1 2020 |
AY2 2021 |
AY3 2022 |
AY4 2023 |
AY5 2024 |
FY1 2025 |
FY2 2026 |
FY3 2027 |
FY4 2028 |
FY5 2029 |
|---|---|---|---|---|---|---|---|---|---|---|
| Revenue | 898.4 | 1,039.1 | 839.2 | 1,041.3 | 1,047.8 | 1,103.2 | 1,161.5 | 1,222.8 | 1,287.4 | 1,355.4 |
| Revenue Growth, % | 0 | 15.67 | -19.24 | 24.07 | 0.62716 | 5.28 | 5.28 | 5.28 | 5.28 | 5.28 |
| EBITDA | 184.1 | 166.5 | 73.2 | 117.9 | 119.1 | 149.9 | 157.8 | 166.1 | 174.9 | 184.1 |
| EBITDA, % | 20.49 | 16.02 | 8.72 | 11.32 | 11.37 | 13.58 | 13.58 | 13.58 | 13.58 | 13.58 |
| Depreciation | 35.8 | 41.6 | 52.4 | 51.2 | 47.5 | 52.3 | 55.0 | 57.9 | 61.0 | 64.2 |
| Depreciation, % | 3.99 | 4 | 6.24 | 4.91 | 4.54 | 4.74 | 4.74 | 4.74 | 4.74 | 4.74 |
| EBIT | 148.2 | 124.9 | 20.8 | 66.8 | 71.6 | 97.6 | 102.8 | 108.2 | 113.9 | 119.9 |
| EBIT, % | 16.5 | 12.02 | 2.48 | 6.41 | 6.83 | 8.85 | 8.85 | 8.85 | 8.85 | 8.85 |
| Total Cash | 226.1 | 198.0 | 159.2 | 253.9 | 324.1 | 261.5 | 275.3 | 289.8 | 305.1 | 321.2 |
| Total Cash, percent | .0 | .0 | .0 | .0 | .0 | .0 | .0 | .0 | .0 | .0 |
| Account Receivables | 596.5 | 704.2 | 648.7 | 749.5 | 728.5 | 778.8 | 819.9 | 863.2 | 908.8 | 956.8 |
| Account Receivables, % | 66.4 | 67.77 | 77.29 | 71.98 | 69.52 | 70.59 | 70.59 | 70.59 | 70.59 | 70.59 |
| Inventories | 412.8 | 539.8 | 537.1 | 413.5 | 441.0 | 537.7 | 566.1 | 596.0 | 627.5 | 660.6 |
| Inventories, % | 45.95 | 51.95 | 64 | 39.71 | 42.09 | 48.74 | 48.74 | 48.74 | 48.74 | 48.74 |
| Accounts Payable | 347.5 | 363.2 | 351.8 | 357.7 | 271.5 | 387.9 | 408.4 | 430.0 | 452.7 | 476.6 |
| Accounts Payable, % | 38.68 | 34.95 | 41.92 | 34.35 | 25.91 | 35.16 | 35.16 | 35.16 | 35.16 | 35.16 |
| Capital Expenditure | -39.4 | -55.9 | -48.3 | -24.5 | -31.7 | -46.1 | -48.6 | -51.1 | -53.8 | -56.7 |
| Capital Expenditure, % | -4.39 | -5.38 | -5.75 | -2.35 | -3.03 | -4.18 | -4.18 | -4.18 | -4.18 | -4.18 |
| Tax Rate, % | 8.67 | 8.67 | 8.67 | 8.67 | 8.67 | 8.67 | 8.67 | 8.67 | 8.67 | 8.67 |
| EBITAT | 129.2 | 108.1 | 13.7 | 53.9 | 65.4 | 80.4 | 84.6 | 89.1 | 93.8 | 98.8 |
| Depreciation | ||||||||||
| Changes in Account Receivables | ||||||||||
| Changes in Inventories | ||||||||||
| Changes in Accounts Payable | ||||||||||
| Capital Expenditure | ||||||||||
| UFCF | -536.2 | -125.2 | 64.7 | 109.1 | -11.4 | 56.0 | 42.0 | 44.3 | 46.6 | 49.1 |
| WACC, % | 4.54 | 4.54 | 4.53 | 4.53 | 4.54 | 4.54 | 4.54 | 4.54 | 4.54 | 4.54 |
| PV UFCF | ||||||||||
| SUM PV UFCF | 209.1 | |||||||||
| Long Term Growth Rate, % | 4.00 | |||||||||
| Free cash flow (T + 1) | 51 | |||||||||
| Terminal Value | 9,532 | |||||||||
| Present Terminal Value | 7,637 | |||||||||
| Enterprise Value | 7,846 | |||||||||
| Net Debt | -286 | |||||||||
| Equity Value | 8,131 | |||||||||
| Diluted Shares Outstanding, MM | 425 | |||||||||
| Equity Value Per Share | 19.13 |
What You Will Receive
- Authentic (300342SZ) Financial Data: Pre-populated with Changshu Tianyin Electromechanical’s historical and projected data for accurate analysis.
- Customizable Template: Easily adjust key variables such as revenue growth, WACC, and EBITDA % as needed.
- Instant Calculations: Watch the intrinsic value of (300342SZ) update in real-time as you make adjustments.
- Professional Valuation Tool: Tailored for investors, analysts, and consultants aiming for precise DCF valuations.
- User-Friendly Interface: Straightforward layout and clear guidance suitable for users of all skill levels.
Key Features
- Comprehensive Historical Data: Access Changshu Tianyin’s financial statements and pre-filled projections.
- Customizable Parameters: Modify WACC, tax rates, revenue growth, and EBITDA margins to fit your analysis.
- Real-Time Valuation: Instantly view the intrinsic value of Changshu Tianyin (300342SZ) as it updates live.
- Intuitive Visualizations: Charts on the dashboard clearly illustrate valuation outcomes and essential metrics.
- Engineered for Precision: A professional-grade tool designed for analysts, investors, and finance professionals.
How It Works
- Step 1: Download the Excel file.
- Step 2: Review the pre-populated data for Changshu Tianyin Electromechanical Co., Ltd (300342SZ) (the [Symbol]) including historical and projected figures.
- Step 3: Modify the key assumptions (highlighted in yellow) according to your analysis.
- Step 4: Observe the automatic recalculation of Changshu Tianyin Electromechanical Co., Ltd (300342SZ)'s intrinsic value.
- Step 5: Leverage the results for your investment strategies or reporting needs.
Why Choose the Calculator from Changshu Tianyin Electromechanical Co., Ltd (300342SZ)?
- Time Efficiency: Skip the hassle of building a DCF model from the ground up – it’s fully prepared for your use.
- Enhanced Accuracy: Dependable financial data and formulas minimize valuation errors.
- Completely Customizable: Adjust the model to suit your specific assumptions and forecasts.
- User-Friendly: Intuitive charts and outputs simplify the analysis of results.
- Endorsed by Professionals: Crafted for industry experts who prioritize both precision and ease of use.
Who Can Benefit from This Product?
- Professional Investors: Develop comprehensive and trustworthy valuation models for investment analysis in (300342SZ).
- Corporate Finance Teams: Assess valuation scenarios to inform strategic decisions within the organization.
- Consultants and Advisors: Deliver precise valuation insights to clients interested in (300342SZ).
- Students and Educators: Utilize real-time data for financial modeling practice and instruction.
- Engineering and Technology Enthusiasts: Gain insights into how companies like Changshu Tianyin Electromechanical are appraised in the market.
Contents of the Template
- Pre-Filled DCF Model: Financial data for Changshu Tianyin Electromechanical Co., Ltd (300342SZ) preloaded for immediate utilization.
- WACC Calculator: Comprehensive calculations for the Weighted Average Cost of Capital.
- Financial Ratios: Assess Changshu Tianyin's profitability, leverage, and operational efficiency.
- Editable Inputs: Modify assumptions such as growth rates, margins, and capital expenditures to match your analysis.
- Financial Statements: Access annual and quarterly reports for thorough evaluations.
- Interactive Dashboard: Effortlessly visualize key valuation metrics and outcomes.
Disclaimer
All information, articles, and product details provided on this website are for general informational and educational purposes only. We do not claim any ownership over, nor do we intend to infringe upon, any trademarks, copyrights, logos, brand names, or other intellectual property mentioned or depicted on this site. Such intellectual property remains the property of its respective owners, and any references here are made solely for identification or informational purposes, without implying any affiliation, endorsement, or partnership.
We make no representations or warranties, express or implied, regarding the accuracy, completeness, or suitability of any content or products presented. Nothing on this website should be construed as legal, tax, investment, financial, medical, or other professional advice. In addition, no part of this site—including articles or product references—constitutes a solicitation, recommendation, endorsement, advertisement, or offer to buy or sell any securities, franchises, or other financial instruments, particularly in jurisdictions where such activity would be unlawful.
All content is of a general nature and may not address the specific circumstances of any individual or entity. It is not a substitute for professional advice or services. Any actions you take based on the information provided here are strictly at your own risk. You accept full responsibility for any decisions or outcomes arising from your use of this website and agree to release us from any liability in connection with your use of, or reliance upon, the content or products found herein.