
|
Pequim VRV Software Corporation Limited (300352.SZ) Avaliação DCF |
Totalmente Editável: Adapte-Se Às Suas Necessidades No Excel Ou Planilhas
Design Profissional: Modelos Confiáveis E Padrão Da Indústria
Pré-Construídos Para Uso Rápido E Eficiente
Compatível com MAC/PC, totalmente desbloqueado
Não É Necessária Experiência; Fácil De Seguir
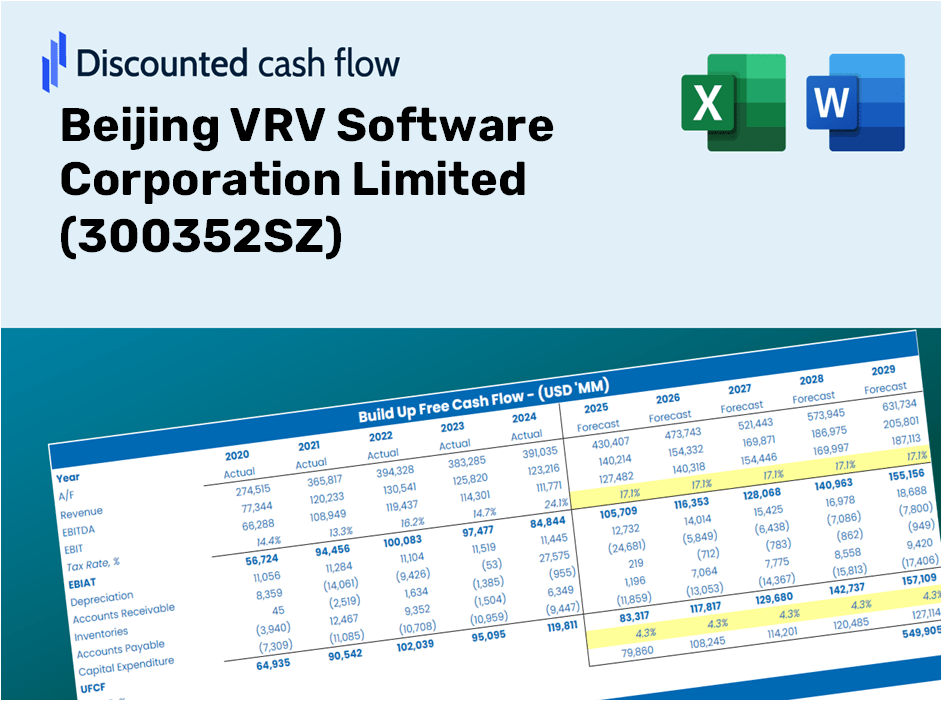
Beijing VRV Software Corporation Limited (300352.SZ) Bundle
Procurando avaliar o valor intrínseco da Pequim VRV Software Corporation Limited? Nossa calculadora DCF (300352SZ) integra dados do mundo real com opções abrangentes de personalização, permitindo refinar as previsões e fazer escolhas de investimento mais informadas.
Discounted Cash Flow (DCF) - (USD MM)
| Year | AY1 2020 |
AY2 2021 |
AY3 2022 |
AY4 2023 |
AY5 2024 |
FY1 2025 |
FY2 2026 |
FY3 2027 |
FY4 2028 |
FY5 2029 |
|---|---|---|---|---|---|---|---|---|---|---|
| Revenue | 640.8 | 675.2 | 542.9 | 682.7 | 516.7 | 500.2 | 484.2 | 468.7 | 453.8 | 439.3 |
| Revenue Growth, % | 0 | 5.36 | -19.59 | 25.76 | -24.31 | -3.2 | -3.2 | -3.2 | -3.2 | -3.2 |
| EBITDA | 57.9 | -476.4 | -174.5 | 67.4 | -103.6 | -103.9 | -100.6 | -97.4 | -94.3 | -91.2 |
| EBITDA, % | 9.03 | -70.56 | -32.15 | 9.87 | -20.05 | -20.77 | -20.77 | -20.77 | -20.77 | -20.77 |
| Depreciation | 43.2 | 53.2 | 55.4 | 58.0 | 57.9 | 44.6 | 43.1 | 41.8 | 40.4 | 39.1 |
| Depreciation, % | 6.75 | 7.88 | 10.2 | 8.49 | 11.21 | 8.91 | 8.91 | 8.91 | 8.91 | 8.91 |
| EBIT | 14.7 | -529.7 | -229.9 | 9.4 | -161.5 | -148.5 | -143.7 | -139.1 | -134.7 | -130.4 |
| EBIT, % | 2.29 | -78.45 | -42.35 | 1.38 | -31.26 | -29.68 | -29.68 | -29.68 | -29.68 | -29.68 |
| Total Cash | 477.4 | 385.0 | 262.9 | 211.4 | 82.1 | 226.9 | 219.7 | 212.6 | 205.9 | 199.3 |
| Total Cash, percent | .0 | .0 | .0 | .0 | .0 | .0 | .0 | .0 | .0 | .0 |
| Account Receivables | 1,087.5 | 642.3 | 468.5 | 638.0 | 619.5 | 475.1 | 459.9 | 445.2 | 431.0 | 417.2 |
| Account Receivables, % | 169.7 | 95.14 | 86.31 | 93.45 | 119.89 | 94.98 | 94.98 | 94.98 | 94.98 | 94.98 |
| Inventories | 295.0 | 624.9 | 724.3 | 357.3 | 308.6 | 350.8 | 339.6 | 328.7 | 318.2 | 308.0 |
| Inventories, % | 46.03 | 92.56 | 133.42 | 52.33 | 59.73 | 70.13 | 70.13 | 70.13 | 70.13 | 70.13 |
| Accounts Payable | 152.4 | 397.9 | 519.0 | 212.2 | 217.8 | 251.7 | 243.6 | 235.8 | 228.3 | 221.0 |
| Accounts Payable, % | 23.78 | 58.94 | 95.6 | 31.08 | 42.16 | 50.31 | 50.31 | 50.31 | 50.31 | 50.31 |
| Capital Expenditure | -77.8 | -61.5 | -57.3 | -100.8 | -64.9 | -59.2 | -57.3 | -55.4 | -53.7 | -51.9 |
| Capital Expenditure, % | -12.14 | -9.11 | -10.55 | -14.76 | -12.57 | -11.83 | -11.83 | -11.83 | -11.83 | -11.83 |
| Tax Rate, % | 14.89 | 14.89 | 14.89 | 14.89 | 14.89 | 14.89 | 14.89 | 14.89 | 14.89 | 14.89 |
| EBITAT | 33.8 | -442.7 | -184.1 | 193.9 | -137.5 | -133.3 | -129.0 | -124.9 | -120.9 | -117.0 |
| Depreciation | ||||||||||
| Changes in Account Receivables | ||||||||||
| Changes in Inventories | ||||||||||
| Changes in Accounts Payable | ||||||||||
| Capital Expenditure | ||||||||||
| UFCF | -1,230.8 | -90.2 | 9.4 | 41.9 | -71.8 | -11.8 | -124.8 | -120.8 | -116.9 | -113.2 |
| WACC, % | 5.12 | 5.11 | 5.1 | 5.12 | 5.11 | 5.11 | 5.11 | 5.11 | 5.11 | 5.11 |
| PV UFCF | ||||||||||
| SUM PV UFCF | -412.2 | |||||||||
| Long Term Growth Rate, % | 2.00 | |||||||||
| Free cash flow (T + 1) | -115 | |||||||||
| Terminal Value | -3,710 | |||||||||
| Present Terminal Value | -2,892 | |||||||||
| Enterprise Value | -3,304 | |||||||||
| Net Debt | 127 | |||||||||
| Equity Value | -3,431 | |||||||||
| Diluted Shares Outstanding, MM | 1,449 | |||||||||
| Equity Value Per Share | -2.37 |
What You Will Receive
- Flexible Forecast Inputs: Easily modify key assumptions (growth %, margins, WACC) to explore different scenarios.
- Comprehensive Market Data: Pre-filled financial data for Beijing VRV Software Corporation Limited (300352SZ) to kickstart your analysis.
- Instant DCF Outputs: The template automatically calculates Net Present Value (NPV) and intrinsic value for your convenience.
- Tailored and Professional: A sleek Excel model designed to meet your specific valuation requirements.
- Designed for Analysts and Investors: Perfect for assessing projections, validating strategies, and enhancing efficiency.
Core Features
- Accurate Financial Data for Beijing VRV: Gain access to reliable pre-loaded historical figures and future forecasts.
- Tailored Forecast Assumptions: Modify highlighted cells for WACC, growth rates, and profit margins as needed.
- Real-Time Calculations: Automatically update your DCF, Net Present Value (NPV), and cash flow assessments.
- User-Friendly Dashboard: Intuitive charts and summaries to help you visualize your valuation outcomes.
- Designed for All Skill Levels: A straightforward, accessible format suitable for investors, CFOs, and consultants alike.
How It Works
- Step 1: Download the Excel file.
- Step 2: Examine the pre-filled financial data and forecasts for Beijing VRV Software Corporation Limited (300352SZ).
- Step 3: Adjust key inputs such as revenue growth, WACC, and tax rates (highlighted cells).
- Step 4: Observe the DCF model update in real-time as you modify your assumptions.
- Step 5: Evaluate the results and utilize them for your investment strategies.
Why Opt for Our Calculator for Beijing VRV Software Corporation Limited (300352SZ)?
- Time-Saving: Jump straight into analysis with a pre-built DCF model – no setup required.
- Enhanced Accuracy: Utilize dependable financial data and formulas to minimize valuation errors.
- Completely Customizable: Adjust the model to suit your specific assumptions and forecasts.
- User-Friendly Outputs: Intuitive charts and results simplify data interpretation.
- Endorsed by Industry Experts: Crafted for professionals who prioritize accuracy and ease of use.
Who Can Benefit from Our Solutions?
- Investors: Utilize a professional-grade valuation tool to empower your investment decisions confidently.
- Financial Analysts: Streamline your workflow with a customizable pre-built DCF model.
- Consultants: Effortlessly modify the template for impactful client presentations or detailed reports.
- Finance Enthusiasts: Enhance your knowledge of valuation methods through practical, real-world examples.
- Educators and Students: Employ this as a hands-on learning resource in finance courses and workshops.
Overview of the Template
- Pre-Filled DCF Model: Financial data for Beijing VRV Software Corporation Limited (300352SZ) preloaded for immediate access.
- WACC Calculator: Comprehensive calculations for the Weighted Average Cost of Capital.
- Financial Ratios: Assess Beijing VRV’s profitability, leverage, and operational efficiency.
- Editable Inputs: Modify key assumptions such as growth rates, margins, and CAPEX to suit your analysis.
- Financial Statements: Access annual and quarterly reports for in-depth evaluation.
- Interactive Dashboard: Effortlessly visualize essential valuation metrics and outcomes.
Disclaimer
All information, articles, and product details provided on this website are for general informational and educational purposes only. We do not claim any ownership over, nor do we intend to infringe upon, any trademarks, copyrights, logos, brand names, or other intellectual property mentioned or depicted on this site. Such intellectual property remains the property of its respective owners, and any references here are made solely for identification or informational purposes, without implying any affiliation, endorsement, or partnership.
We make no representations or warranties, express or implied, regarding the accuracy, completeness, or suitability of any content or products presented. Nothing on this website should be construed as legal, tax, investment, financial, medical, or other professional advice. In addition, no part of this site—including articles or product references—constitutes a solicitation, recommendation, endorsement, advertisement, or offer to buy or sell any securities, franchises, or other financial instruments, particularly in jurisdictions where such activity would be unlawful.
All content is of a general nature and may not address the specific circumstances of any individual or entity. It is not a substitute for professional advice or services. Any actions you take based on the information provided here are strictly at your own risk. You accept full responsibility for any decisions or outcomes arising from your use of this website and agree to release us from any liability in connection with your use of, or reliance upon, the content or products found herein.