
|
Yangzhou Yangjie Electronic Technology Co., Ltd. (300373.SZ) Avaliação DCF |
Totalmente Editável: Adapte-Se Às Suas Necessidades No Excel Ou Planilhas
Design Profissional: Modelos Confiáveis E Padrão Da Indústria
Pré-Construídos Para Uso Rápido E Eficiente
Compatível com MAC/PC, totalmente desbloqueado
Não É Necessária Experiência; Fácil De Seguir
Yangzhou Yangjie Electronic Technology Co., Ltd. (300373.SZ) Bundle
Descubra o verdadeiro valor de Yangzhou Yangjie Electronic Technology Co., Ltd. (300373SZ) com nossa calculadora DCF avançada! Ajuste as suposições críticas, explore vários cenários e avalie como diferentes mudanças influenciam a avaliação de Yangzhou Yangjie Electronic Technology Co., Ltd. (300373SZ)-tudo dentro de um modelo de excelamento fácil de usar.
Discounted Cash Flow (DCF) - (USD MM)
| Year | AY1 2020 |
AY2 2021 |
AY3 2022 |
AY4 2023 |
AY5 2024 |
FY1 2025 |
FY2 2026 |
FY3 2027 |
FY4 2028 |
FY5 2029 |
|---|---|---|---|---|---|---|---|---|---|---|
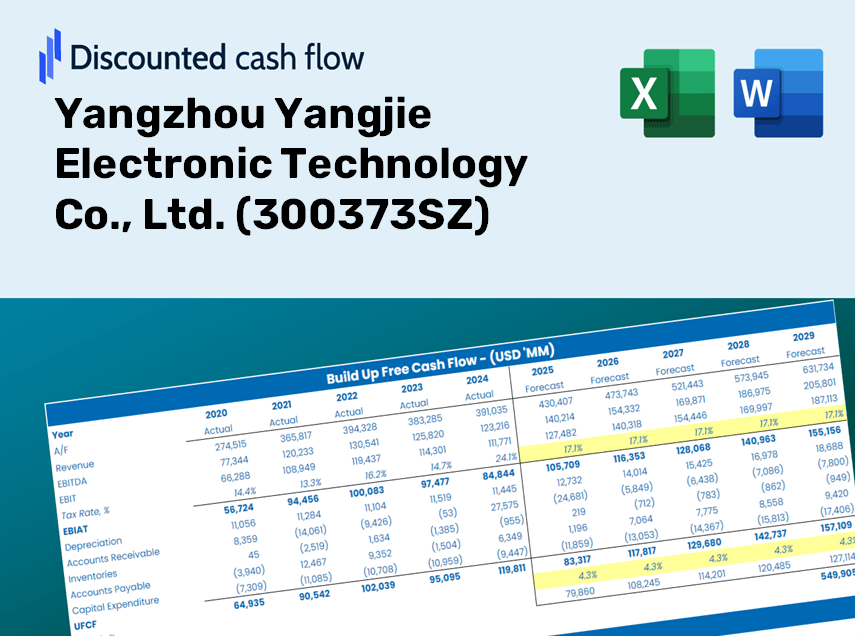
| Revenue | 2,617.0 | 4,396.6 | 5,403.5 | 5,409.8 | 6,033.4 | 7,580.2 | 9,523.5 | 11,965.0 | 15,032.5 | 18,886.5 |
| Revenue Growth, % | 0 | 68 | 22.9 | 0.11664 | 11.53 | 25.64 | 25.64 | 25.64 | 25.64 | 25.64 |
| EBITDA | 645.3 | 1,155.9 | 1,654.7 | 1,697.5 | 1,815.2 | 2,168.4 | 2,724.3 | 3,422.8 | 4,300.3 | 5,402.8 |
| EBITDA, % | 24.66 | 26.29 | 30.62 | 31.38 | 30.09 | 28.61 | 28.61 | 28.61 | 28.61 | 28.61 |
| Depreciation | 187.4 | 245.1 | 372.6 | 548.1 | 597.4 | 601.3 | 755.5 | 949.1 | 1,192.5 | 1,498.2 |
| Depreciation, % | 7.16 | 5.57 | 6.9 | 10.13 | 9.9 | 7.93 | 7.93 | 7.93 | 7.93 | 7.93 |
| EBIT | 457.9 | 910.8 | 1,282.1 | 1,149.4 | 1,217.8 | 1,567.1 | 1,968.9 | 2,473.7 | 3,107.8 | 3,904.6 |
| EBIT, % | 17.5 | 20.72 | 23.73 | 21.25 | 20.18 | 20.67 | 20.67 | 20.67 | 20.67 | 20.67 |
| Total Cash | 394.2 | 1,647.8 | 1,520.5 | 3,560.0 | 4,190.5 | 3,273.8 | 4,113.1 | 5,167.5 | 6,492.3 | 8,156.8 |
| Total Cash, percent | .0 | .0 | .0 | .0 | .0 | .0 | .0 | .0 | .0 | .0 |
| Account Receivables | 1,136.6 | 1,197.3 | 1,452.8 | 1,760.2 | 2,138.4 | 2,509.5 | 3,152.9 | 3,961.2 | 4,976.7 | 6,252.6 |
| Account Receivables, % | 43.43 | 27.23 | 26.89 | 32.54 | 35.44 | 33.11 | 33.11 | 33.11 | 33.11 | 33.11 |
| Inventories | 431.7 | 997.0 | 1,213.2 | 1,145.3 | 1,227.2 | 1,563.6 | 1,964.4 | 2,468.0 | 3,100.7 | 3,895.7 |
| Inventories, % | 16.49 | 22.68 | 22.45 | 21.17 | 20.34 | 20.63 | 20.63 | 20.63 | 20.63 | 20.63 |
| Accounts Payable | 680.2 | 1,178.9 | 1,450.3 | 1,188.1 | 1,992.0 | 2,040.9 | 2,564.1 | 3,221.5 | 4,047.4 | 5,085.0 |
| Accounts Payable, % | 25.99 | 26.81 | 26.84 | 21.96 | 33.02 | 26.92 | 26.92 | 26.92 | 26.92 | 26.92 |
| Capital Expenditure | -315.8 | -1,171.7 | -837.2 | -456.7 | -863.5 | -1,166.8 | -1,465.9 | -1,841.7 | -2,313.9 | -2,907.1 |
| Capital Expenditure, % | -12.07 | -26.65 | -15.49 | -8.44 | -14.31 | -15.39 | -15.39 | -15.39 | -15.39 | -15.39 |
| Tax Rate, % | 14.33 | 14.33 | 14.33 | 14.33 | 14.33 | 14.33 | 14.33 | 14.33 | 14.33 | 14.33 |
| EBITAT | 384.7 | 741.8 | 1,087.0 | 1,019.8 | 1,043.3 | 1,330.9 | 1,672.2 | 2,100.8 | 2,639.4 | 3,316.1 |
| Depreciation | ||||||||||
| Changes in Account Receivables | ||||||||||
| Changes in Inventories | ||||||||||
| Changes in Accounts Payable | ||||||||||
| Capital Expenditure | ||||||||||
| UFCF | -631.8 | -312.1 | 422.0 | 609.5 | 1,121.1 | 106.9 | 440.7 | 553.7 | 695.6 | 874.0 |
| WACC, % | 6.68 | 6.68 | 6.68 | 6.69 | 6.69 | 6.68 | 6.68 | 6.68 | 6.68 | 6.68 |
| PV UFCF | ||||||||||
| SUM PV UFCF | 2,112.8 | |||||||||
| Long Term Growth Rate, % | 3.00 | |||||||||
| Free cash flow (T + 1) | 900 | |||||||||
| Terminal Value | 24,432 | |||||||||
| Present Terminal Value | 17,679 | |||||||||
| Enterprise Value | 19,791 | |||||||||
| Net Debt | -2,284 | |||||||||
| Equity Value | 22,075 | |||||||||
| Diluted Shares Outstanding, MM | 542 | |||||||||
| Equity Value Per Share | 40.74 |
What You Will Receive
- Genuine Yangjie Data: Preloaded financial metrics – including revenue and EBIT – based on actual and projected figures for Yangzhou Yangjie Electronic Technology Co., Ltd. (300373SZ).
- Comprehensive Customization: Modify all essential parameters (yellow cells) such as WACC, growth %, and tax rates easily.
- Instant Valuation Adjustments: Automated recalculations to assess the impact of any changes on Yangjie's fair value.
- Flexible Excel Template: Designed for quick modifications, scenario analysis, and in-depth projections.
- Efficient and Accurate: Eliminate the need to build models from scratch while ensuring precision and adaptability.
Key Features
- Real-Time YANGJIE Data: Pre-filled with Yangzhou Yangjie Electronic Technology Co., Ltd.'s historical financials and future projections.
- Customizable Assumptions: Modify parameters such as revenue growth, profit margins, WACC, tax rates, and capital expenditures to suit your analysis.
- Dynamic Valuation Tool: Automatic recalculations of Net Present Value (NPV) and intrinsic value based on your specified inputs.
- Scenario Analysis: Develop various forecast scenarios to explore different valuation possibilities.
- User-Friendly Interface: Intuitive, well-organized interface suitable for both seasoned professionals and newcomers.
How It Functions
- Step 1: Download the ready-to-use Excel template featuring Yangzhou Yangjie Electronic Technology Co., Ltd.'s (300373SZ) data.
- Step 2: Navigate through the pre-filled sheets to familiarize yourself with the essential metrics.
- Step 3: Revise forecasts and assumptions in the editable yellow cells (WACC, growth, margins).
- Step 4: Instantly see recalibrated results, including the intrinsic value of Yangzhou Yangjie Electronic Technology Co., Ltd. (300373SZ).
- Step 5: Utilize the outputs to make informed investment choices or to create detailed reports.
Why Opt for Yangzhou Yangjie Electronic Technology Co., Ltd. Calculator?
- All-in-One Solution: Combines DCF, WACC, and comprehensive financial ratio analyses into a single tool.
- Flexible Input Options: Modify the yellow-highlighted cells to explore different financial scenarios.
- In-Depth Analysis: Automatically computes the intrinsic value and Net Present Value for Yangzhou Yangjie (300373SZ).
- Built-in Data: Historical and projected data provided for reliable and accurate analysis.
- High-Quality Standards: Perfect for financial analysts, investors, and business consultants alike.
Who Should Use This Product?
- Investors: Accurately assess the fair value of Yangzhou Yangjie Electronic Technology Co., Ltd. (300373SZ) before making investment choices.
- CFOs: Utilize a high-quality DCF model for financial reporting and in-depth analysis.
- Consultants: Effortlessly customize the template for client valuation reports.
- Entrepreneurs: Understand financial modeling practices used by leading technology firms.
- Educators: Employ it as a resource to showcase valuation techniques in the classroom.
Contents of the Template
- Preloaded YANGJIE Data: Historical and projected financial metrics, including revenue, EBIT, and capital expenditures.
- DCF and WACC Models: Professional-grade spreadsheets for assessing intrinsic value and calculating the Weighted Average Cost of Capital.
- Editable Inputs: Cells highlighted in yellow for customizing revenue growth, tax rates, and discount rates.
- Financial Statements: Detailed annual and quarterly financial reports for in-depth analysis.
- Key Ratios: Metrics on profitability, leverage, and efficiency for performance evaluation.
- Dashboard and Charts: Visual representations of valuation results and underlying assumptions.
Disclaimer
All information, articles, and product details provided on this website are for general informational and educational purposes only. We do not claim any ownership over, nor do we intend to infringe upon, any trademarks, copyrights, logos, brand names, or other intellectual property mentioned or depicted on this site. Such intellectual property remains the property of its respective owners, and any references here are made solely for identification or informational purposes, without implying any affiliation, endorsement, or partnership.
We make no representations or warranties, express or implied, regarding the accuracy, completeness, or suitability of any content or products presented. Nothing on this website should be construed as legal, tax, investment, financial, medical, or other professional advice. In addition, no part of this site—including articles or product references—constitutes a solicitation, recommendation, endorsement, advertisement, or offer to buy or sell any securities, franchises, or other financial instruments, particularly in jurisdictions where such activity would be unlawful.
All content is of a general nature and may not address the specific circumstances of any individual or entity. It is not a substitute for professional advice or services. Any actions you take based on the information provided here are strictly at your own risk. You accept full responsibility for any decisions or outcomes arising from your use of this website and agree to release us from any liability in connection with your use of, or reliance upon, the content or products found herein.