
|
Canmax Technologies Co., Ltd. (300390.SZ) Avaliação DCF |
Totalmente Editável: Adapte-Se Às Suas Necessidades No Excel Ou Planilhas
Design Profissional: Modelos Confiáveis E Padrão Da Indústria
Pré-Construídos Para Uso Rápido E Eficiente
Compatível com MAC/PC, totalmente desbloqueado
Não É Necessária Experiência; Fácil De Seguir
Canmax Technologies Co., Ltd. (300390.SZ) Bundle
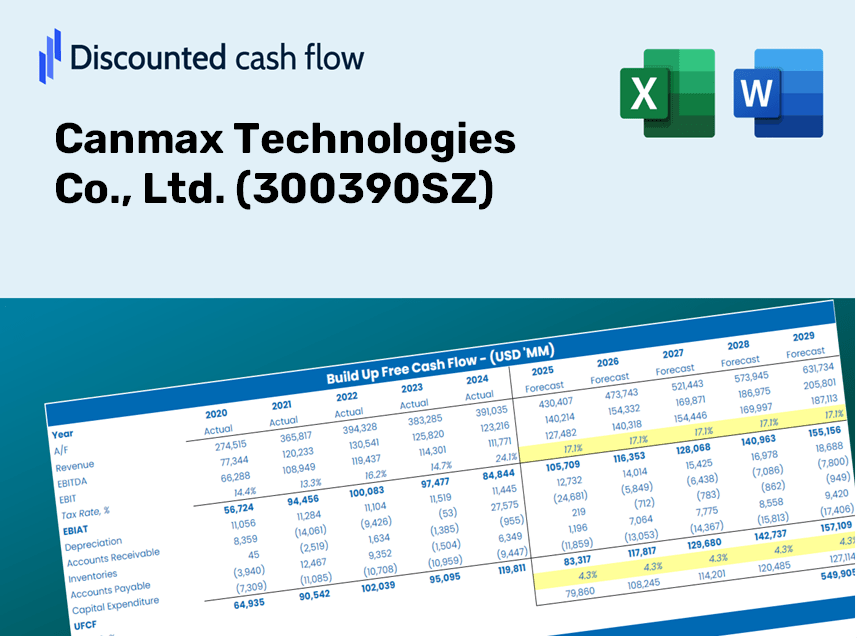
Avalie as perspectivas financeiras da Canmax Technologies Co., Ltd. Como um especialista! Esta calculadora DCF (300390SZ) fornece dados financeiros pré-preenchidos e oferece total flexibilidade para modificar o crescimento da receita, o WACC, as margens e outras suposições essenciais para se alinhar às suas previsões.
Discounted Cash Flow (DCF) - (USD MM)
| Year | AY1 2020 |
AY2 2021 |
AY3 2022 |
AY4 2023 |
AY5 2024 |
FY1 2025 |
FY2 2026 |
FY3 2027 |
FY4 2028 |
FY5 2029 |
|---|---|---|---|---|---|---|---|---|---|---|
| Revenue | 1,313.2 | 3,397.6 | 17,030.5 | 10,467.7 | 6,608.3 | 6,009.5 | 5,465.1 | 4,970.0 | 4,519.7 | 4,110.2 |
| Revenue Growth, % | 0 | 158.73 | 401.26 | -38.54 | -36.87 | -9.06 | -9.06 | -9.06 | -9.06 | -9.06 |
| EBITDA | 371.5 | 1,602.2 | 10,537.8 | 2,826.8 | 1,790.8 | 2,300.8 | 2,092.3 | 1,902.8 | 1,730.4 | 1,573.6 |
| EBITDA, % | 28.29 | 47.16 | 61.88 | 27 | 27.1 | 38.29 | 38.29 | 38.29 | 38.29 | 38.29 |
| Depreciation | 41.2 | 101.5 | 164.9 | 261.5 | 485.2 | 203.6 | 185.1 | 168.3 | 153.1 | 139.2 |
| Depreciation, % | 3.14 | 2.99 | 0.96799 | 2.5 | 7.34 | 3.39 | 3.39 | 3.39 | 3.39 | 3.39 |
| EBIT | 330.2 | 1,500.8 | 10,372.9 | 2,565.2 | 1,305.6 | 2,097.2 | 1,907.2 | 1,734.4 | 1,577.3 | 1,434.4 |
| EBIT, % | 25.15 | 44.17 | 60.91 | 24.51 | 19.76 | 34.9 | 34.9 | 34.9 | 34.9 | 34.9 |
| Total Cash | 271.4 | 1,099.3 | 8,505.6 | 7,340.4 | 3,190.4 | 2,660.7 | 2,419.6 | 2,200.4 | 2,001.0 | 1,819.8 |
| Total Cash, percent | .0 | .0 | .0 | .0 | .0 | .0 | .0 | .0 | .0 | .0 |
| Account Receivables | 222.4 | 557.2 | 2,790.3 | 758.6 | 636.9 | 800.5 | 728.0 | 662.0 | 602.1 | 547.5 |
| Account Receivables, % | 16.93 | 16.4 | 16.38 | 7.25 | 9.64 | 13.32 | 13.32 | 13.32 | 13.32 | 13.32 |
| Inventories | 296.1 | 1,232.0 | 2,239.2 | 1,375.1 | 2,324.2 | 1,445.4 | 1,314.5 | 1,195.4 | 1,087.1 | 988.6 |
| Inventories, % | 22.54 | 36.26 | 13.15 | 13.14 | 35.17 | 24.05 | 24.05 | 24.05 | 24.05 | 24.05 |
| Accounts Payable | 205.7 | 718.7 | 1,535.1 | 1,262.4 | 1,291.7 | 930.8 | 846.4 | 769.7 | 700.0 | 636.6 |
| Accounts Payable, % | 15.67 | 21.15 | 9.01 | 12.06 | 19.55 | 15.49 | 15.49 | 15.49 | 15.49 | 15.49 |
| Capital Expenditure | -88.3 | -816.3 | -1,862.5 | -2,369.2 | -607.7 | -883.6 | -803.6 | -730.8 | -664.5 | -604.3 |
| Capital Expenditure, % | -6.72 | -24.03 | -10.94 | -22.63 | -9.2 | -14.7 | -14.7 | -14.7 | -14.7 | -14.7 |
| Tax Rate, % | 31.15 | 31.15 | 31.15 | 31.15 | 31.15 | 31.15 | 31.15 | 31.15 | 31.15 | 31.15 |
| EBITAT | 288.1 | 929.4 | 6,622.3 | 1,722.9 | 898.9 | 1,463.9 | 1,331.3 | 1,210.7 | 1,101.0 | 1,001.3 |
| Depreciation | ||||||||||
| Changes in Account Receivables | ||||||||||
| Changes in Inventories | ||||||||||
| Changes in Accounts Payable | ||||||||||
| Capital Expenditure | ||||||||||
| UFCF | -71.7 | -543.3 | 2,500.7 | 2,238.5 | -21.8 | 1,138.0 | 832.0 | 756.6 | 688.1 | 625.7 |
| WACC, % | 7.44 | 7.33 | 7.34 | 7.35 | 7.36 | 7.36 | 7.36 | 7.36 | 7.36 | 7.36 |
| PV UFCF | ||||||||||
| SUM PV UFCF | 3,349.6 | |||||||||
| Long Term Growth Rate, % | 0.50 | |||||||||
| Free cash flow (T + 1) | 629 | |||||||||
| Terminal Value | 9,161 | |||||||||
| Present Terminal Value | 6,422 | |||||||||
| Enterprise Value | 9,772 | |||||||||
| Net Debt | -808 | |||||||||
| Equity Value | 10,579 | |||||||||
| Diluted Shares Outstanding, MM | 839 | |||||||||
| Equity Value Per Share | 12.61 |
What You Will Receive
- Customizable Excel Template: A fully adjustable Excel-based DCF Calculator featuring pre-populated financial data for Canmax Technologies Co., Ltd. (300390SZ).
- Comprehensive Data: Access to historical figures and forward-looking projections (highlighted in the yellow cells).
- Flexible Forecasting: Easily modify assumptions such as revenue growth, EBITDA %, and WACC.
- Instant Calculations: Quickly observe how your inputs affect Canmax’s valuation.
- Professional Resource: Designed for investors, CFOs, consultants, and financial analysts.
- Intuitive Layout: Organized for simplicity and convenience, complete with step-by-step guidance.
Key Features
- Real-Time Canmax Data: Pre-loaded with Canmax Technologies’ historical financial performance and future projections.
- Completely Customizable Parameters: Modify growth rates, profit margins, WACC, tax rates, and capital investment figures.
- Interactive Valuation Model: Automatic recalculations of Net Present Value (NPV) and intrinsic value based on your specified inputs.
- Scenario Analysis: Develop multiple forecasting scenarios to explore various valuation results.
- User-Centric Interface: Intuitive, organized design suitable for both professionals and newcomers.
How It Works
- Step 1: Download the Excel file.
- Step 2: Review the pre-filled data for Canmax Technologies (300390SZ) including historical and projected figures.
- Step 3: Modify the key assumptions (highlighted in yellow) based on your analysis.
- Step 4: Observe the automatic recalculations reflecting the intrinsic value of Canmax Technologies (300390SZ).
- Step 5: Utilize the results for making informed investment decisions or for reporting purposes.
Why Choose This Calculator for Canmax Technologies Co., Ltd. (300390SZ)?
- Designed for Experts: A sophisticated tool preferred by analysts, CFOs, and consultants.
- Accurate Financial Data: Canmax’s historical and projected financials are preloaded for precision.
- Flexible Scenario Analysis: Effortlessly simulate various forecasts and assumptions.
- Comprehensive Outputs: Automatically computes intrinsic value, NPV, and essential metrics.
- User-Friendly: Step-by-step guidance helps you navigate the calculator with ease.
Who Can Benefit from Canmax Technologies Co., Ltd. (300390SZ)?
- Investors: Make informed investment decisions with a cutting-edge valuation tool designed for precision.
- Financial Analysts: Streamline your workflow with an easily customizable DCF model at your fingertips.
- Consultants: Effortlessly modify the template for impactful client presentations or comprehensive reports.
- Finance Enthusiasts: Enhance your grasp of valuation methods through practical, real-world scenarios.
- Educators and Students: Leverage this resource as a hands-on learning aid in finance classes.
Contents of the Template
- Pre-Filled Data: Provides Canmax Technologies’ historical financials and projections.
- Discounted Cash Flow Model: An editable DCF valuation model with built-in calculations.
- Weighted Average Cost of Capital (WACC): A specific sheet for WACC calculations using tailored inputs.
- Key Financial Ratios: Evaluate Canmax’s profitability, efficiency, and leverage metrics.
- Customizable Inputs: Easily modify revenue growth, profit margins, and tax rates.
- Clear Dashboard: Visuals and tables that highlight crucial valuation outcomes.
Disclaimer
All information, articles, and product details provided on this website are for general informational and educational purposes only. We do not claim any ownership over, nor do we intend to infringe upon, any trademarks, copyrights, logos, brand names, or other intellectual property mentioned or depicted on this site. Such intellectual property remains the property of its respective owners, and any references here are made solely for identification or informational purposes, without implying any affiliation, endorsement, or partnership.
We make no representations or warranties, express or implied, regarding the accuracy, completeness, or suitability of any content or products presented. Nothing on this website should be construed as legal, tax, investment, financial, medical, or other professional advice. In addition, no part of this site—including articles or product references—constitutes a solicitation, recommendation, endorsement, advertisement, or offer to buy or sell any securities, franchises, or other financial instruments, particularly in jurisdictions where such activity would be unlawful.
All content is of a general nature and may not address the specific circumstances of any individual or entity. It is not a substitute for professional advice or services. Any actions you take based on the information provided here are strictly at your own risk. You accept full responsibility for any decisions or outcomes arising from your use of this website and agree to release us from any liability in connection with your use of, or reliance upon, the content or products found herein.