
|
Zhejiang Jindun Fans Co., Ltd (300411.sz) Avaliação DCF |
Totalmente Editável: Adapte-Se Às Suas Necessidades No Excel Ou Planilhas
Design Profissional: Modelos Confiáveis E Padrão Da Indústria
Pré-Construídos Para Uso Rápido E Eficiente
Compatível com MAC/PC, totalmente desbloqueado
Não É Necessária Experiência; Fácil De Seguir
Zhejiang Jindun Fans Co., Ltd (300411.SZ) Bundle
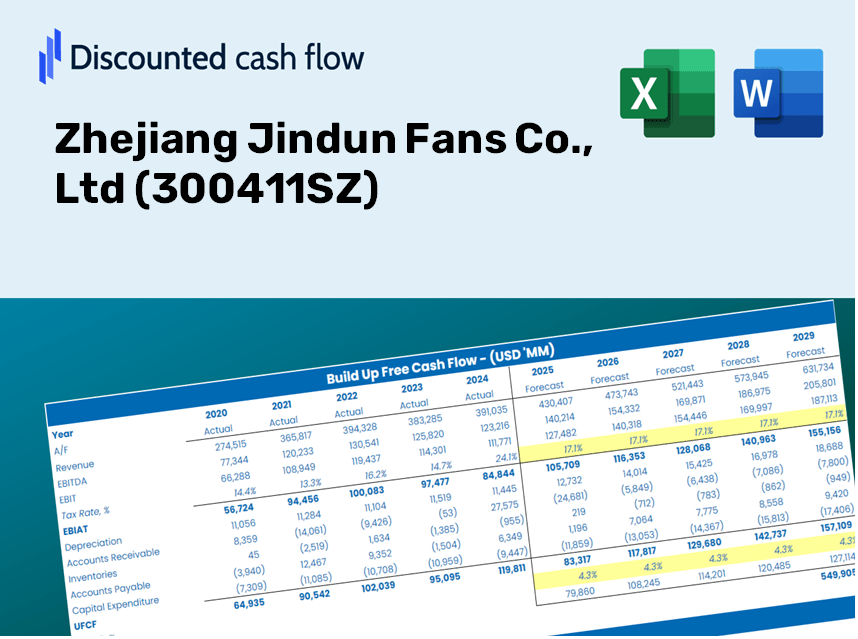
Economize tempo e melhore a precisão com a nossa calculadora DCF (300411SZ)! Equipado com dados reais da Zhejiang Jindun Fans Co., Ltd e suposições personalizáveis, essa ferramenta permite que você preveja, analise e valorize os fãs de Zhejiang Jindun como um investidor experiente.
Discounted Cash Flow (DCF) - (USD MM)
| Year | AY1 2020 |
AY2 2021 |
AY3 2022 |
AY4 2023 |
AY5 2024 |
FY1 2025 |
FY2 2026 |
FY3 2027 |
FY4 2028 |
FY5 2029 |
|---|---|---|---|---|---|---|---|---|---|---|
| Revenue | 733.8 | 490.4 | 426.6 | 485.7 | 522.2 | 489.8 | 459.5 | 431.0 | 404.3 | 379.2 |
| Revenue Growth, % | 0 | -33.17 | -13.02 | 13.87 | 7.52 | -6.2 | -6.2 | -6.2 | -6.2 | -6.2 |
| EBITDA | -115.3 | -1.3 | 35.5 | 28.5 | 26.1 | 3.1 | 2.9 | 2.8 | 2.6 | 2.4 |
| EBITDA, % | -15.71 | -0.26691 | 8.31 | 5.88 | 5 | 0.64134 | 0.64134 | 0.64134 | 0.64134 | 0.64134 |
| Depreciation | 28.2 | 20.2 | 15.8 | 16.4 | 17.0 | 17.9 | 16.8 | 15.8 | 14.8 | 13.9 |
| Depreciation, % | 3.85 | 4.11 | 3.7 | 3.38 | 3.25 | 3.66 | 3.66 | 3.66 | 3.66 | 3.66 |
| EBIT | -143.5 | -21.5 | 19.7 | 12.1 | 9.1 | -14.8 | -13.9 | -13.0 | -12.2 | -11.4 |
| EBIT, % | -19.56 | -4.38 | 4.61 | 2.5 | 1.74 | -3.02 | -3.02 | -3.02 | -3.02 | -3.02 |
| Total Cash | 334.3 | 200.0 | 194.2 | 199.9 | 178.1 | 202.9 | 190.4 | 178.6 | 167.5 | 157.1 |
| Total Cash, percent | .0 | .0 | .0 | .0 | .0 | .0 | .0 | .0 | .0 | .0 |
| Account Receivables | 549.5 | 433.1 | 515.2 | 517.9 | 563.2 | 453.8 | 425.6 | 399.3 | 374.5 | 351.3 |
| Account Receivables, % | 74.89 | 88.31 | 120.77 | 106.63 | 107.84 | 92.64 | 92.64 | 92.64 | 92.64 | 92.64 |
| Inventories | 219.0 | 251.0 | 346.1 | 378.6 | 285.3 | 288.7 | 270.8 | 254.0 | 238.3 | 223.5 |
| Inventories, % | 29.84 | 51.18 | 81.15 | 77.94 | 54.62 | 58.95 | 58.95 | 58.95 | 58.95 | 58.95 |
| Accounts Payable | 117.7 | 167.4 | 146.7 | 193.2 | 189.9 | 157.4 | 147.7 | 138.5 | 129.9 | 121.9 |
| Accounts Payable, % | 16.04 | 34.13 | 34.39 | 39.78 | 36.36 | 32.14 | 32.14 | 32.14 | 32.14 | 32.14 |
| Capital Expenditure | -8.1 | -56.4 | -17.3 | -27.9 | -37.6 | -29.0 | -27.2 | -25.5 | -23.9 | -22.4 |
| Capital Expenditure, % | -1.1 | -11.49 | -4.06 | -5.74 | -7.19 | -5.92 | -5.92 | -5.92 | -5.92 | -5.92 |
| Tax Rate, % | -46.28 | -46.28 | -46.28 | -46.28 | -46.28 | -46.28 | -46.28 | -46.28 | -46.28 | -46.28 |
| EBITAT | -190.5 | -23.4 | 16.0 | 10.8 | 13.3 | -13.9 | -13.0 | -12.2 | -11.5 | -10.8 |
| Depreciation | ||||||||||
| Changes in Account Receivables | ||||||||||
| Changes in Inventories | ||||||||||
| Changes in Accounts Payable | ||||||||||
| Capital Expenditure | ||||||||||
| UFCF | -821.2 | 74.5 | -183.4 | 10.6 | 37.5 | 48.5 | 12.9 | 12.1 | 11.3 | 10.6 |
| WACC, % | 4.92 | 4.92 | 4.92 | 4.92 | 4.92 | 4.92 | 4.92 | 4.92 | 4.92 | 4.92 |
| PV UFCF | ||||||||||
| SUM PV UFCF | 86.1 | |||||||||
| Long Term Growth Rate, % | 4.00 | |||||||||
| Free cash flow (T + 1) | 11 | |||||||||
| Terminal Value | 1,197 | |||||||||
| Present Terminal Value | 941 | |||||||||
| Enterprise Value | 1,027 | |||||||||
| Net Debt | -169 | |||||||||
| Equity Value | 1,196 | |||||||||
| Diluted Shares Outstanding, MM | 418 | |||||||||
| Equity Value Per Share | 2.86 |
What You Will Receive
- Authentic 300411SZ Financial Data: Access to both historical and projected metrics for precise valuation.
- Customizable Parameters: Adjust WACC, tax rates, revenue growth, and capital expenditures as needed.
- Real-Time Calculations: Automatically computes intrinsic value and NPV for you.
- Scenario Testing: Explore various scenarios to assess the future performance of Zhejiang Jindun Fans Co., Ltd.
- User-Friendly Interface: Designed for professionals while remaining accessible for novices.
Key Features
- Comprehensive Jindun Data: Pre-loaded with Zhejiang Jindun Fans Co., Ltd's historical financial performance and future projections.
- Fully Customizable Parameters: Tailor revenue growth rates, profit margins, WACC, tax rates, and capital expenditures to fit your analysis.
- Dynamic Valuation Tool: Automatically refreshes Net Present Value (NPV) and intrinsic value based on your chosen parameters.
- Scenario Analysis: Develop various forecasting scenarios to evaluate different valuation possibilities.
- User-Centric Interface: Intuitive layout designed for both experienced analysts and newcomers.
How It Functions
- 1. Access the Template: Download and open the Excel file containing Zhejiang Jindun Fans Co., Ltd’s (300411SZ) preloaded data.
- 2. Modify Assumptions: Adjust essential inputs such as growth rates, WACC, and capital expenditures to fit your analysis.
- 3. Instant Results: The DCF model automatically calculates intrinsic value and NPV in real-time.
- 4. Explore Scenarios: Evaluate multiple forecasts to investigate various valuation outcomes.
- 5. Present with Assurance: Deliver professional valuation insights to bolster your decision-making process.
Why Opt for Zhejiang Jindun Fans Co., Ltd (300411SZ) Products?
- Time Efficiency: Eliminate the hassle of starting from scratch – our solutions are ready for immediate use.
- Enhanced Precision: Dependable data and methodologies minimize the likelihood of errors in your evaluations.
- Completely Adaptable: Customize products to align with your specific requirements and forecasts.
- User-Friendly: Intuitive designs and outputs ensure that results are straightforward to analyze.
- Endorsed by Professionals: Crafted for industry experts who prioritize both accuracy and ease of use.
Who Can Benefit from This Product?
- Investors: Seamlessly assess the fair value of Zhejiang Jindun Fans Co., Ltd (300411SZ) before making investment choices.
- CFOs: Utilize a high-quality DCF model for accurate financial reporting and analysis.
- Consultants: Easily customize the template for client valuation reports.
- Entrepreneurs: Acquire knowledge of financial modeling techniques employed by leading companies.
- Educators: Employ this tool to illustrate various valuation methodologies in the classroom.
What the Template Includes
- Pre-Filled DCF Model: Zhejiang Jindun Fans Co., Ltd's financial data preloaded for immediate utilization.
- WACC Calculator: Comprehensive calculations for the Weighted Average Cost of Capital.
- Financial Ratios: Assess Zhejiang Jindun's profitability, leverage, and efficiency metrics.
- Editable Inputs: Modify assumptions such as growth rates, margins, and capital expenditures to align with your scenarios.
- Financial Statements: Annual and quarterly reports available for in-depth analysis.
- Interactive Dashboard: Effortlessly visualize essential valuation metrics and outcomes.
Disclaimer
All information, articles, and product details provided on this website are for general informational and educational purposes only. We do not claim any ownership over, nor do we intend to infringe upon, any trademarks, copyrights, logos, brand names, or other intellectual property mentioned or depicted on this site. Such intellectual property remains the property of its respective owners, and any references here are made solely for identification or informational purposes, without implying any affiliation, endorsement, or partnership.
We make no representations or warranties, express or implied, regarding the accuracy, completeness, or suitability of any content or products presented. Nothing on this website should be construed as legal, tax, investment, financial, medical, or other professional advice. In addition, no part of this site—including articles or product references—constitutes a solicitation, recommendation, endorsement, advertisement, or offer to buy or sell any securities, franchises, or other financial instruments, particularly in jurisdictions where such activity would be unlawful.
All content is of a general nature and may not address the specific circumstances of any individual or entity. It is not a substitute for professional advice or services. Any actions you take based on the information provided here are strictly at your own risk. You accept full responsibility for any decisions or outcomes arising from your use of this website and agree to release us from any liability in connection with your use of, or reliance upon, the content or products found herein.