
|
Mango Excelente Media Co., Ltd. (300413.SZ) Avaliação DCF |
Totalmente Editável: Adapte-Se Às Suas Necessidades No Excel Ou Planilhas
Design Profissional: Modelos Confiáveis E Padrão Da Indústria
Pré-Construídos Para Uso Rápido E Eficiente
Compatível com MAC/PC, totalmente desbloqueado
Não É Necessária Experiência; Fácil De Seguir
Mango Excellent Media Co., Ltd. (300413.SZ) Bundle
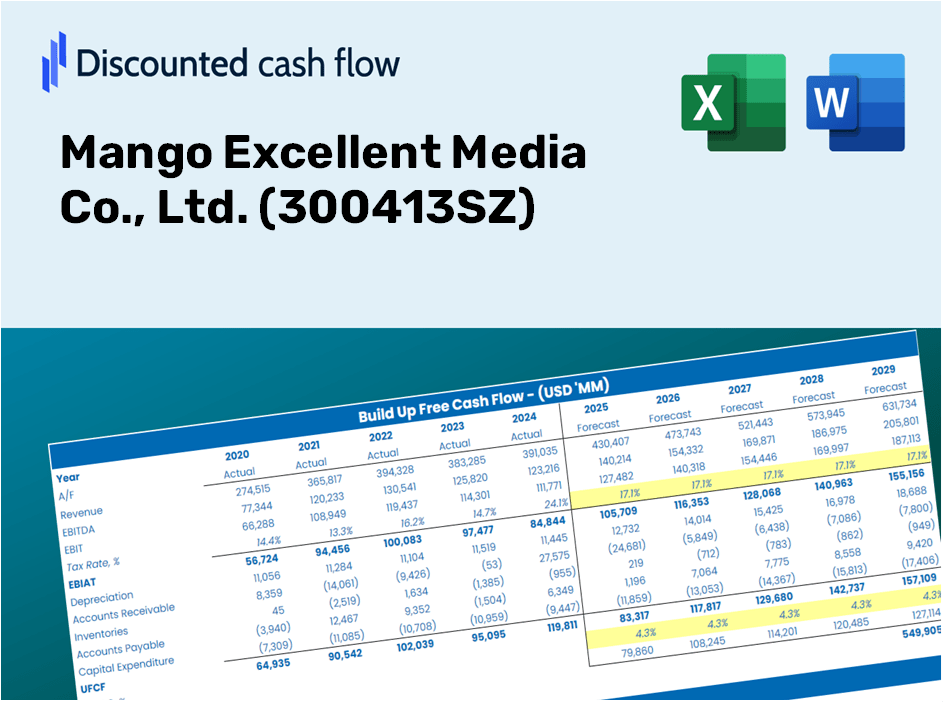
Avalie as perspectivas financeiras da Mango Excelente Media Co., Ltd. Como um especialista! Esta calculadora DCF (300413SZ) fornece dados financeiros pré-preenchidos e a flexibilidade completa para modificar o crescimento da receita, o WACC, as margens e outras suposições críticas para se alinhar às suas previsões.
What You Will Receive
- Customizable Excel Template: A comprehensive, editable DCF Calculator in Excel, complete with pre-loaded financials for Mango Excellent Media Co., Ltd. (300413SZ).
- Accurate Historical Data: Access reliable historical figures and future projections (highlighted in the yellow cells).
- Flexible Forecasting: Adjust key assumptions such as revenue growth rates, EBITDA percentages, and WACC at your discretion.
- Instant Calculations: Quickly observe how your input changes affect the valuation of Mango Excellent Media Co., Ltd. (300413SZ).
- Professional Resource: Designed specifically for investors, CFOs, consultants, and financial analysts.
- Intuitive Design: Organized for straightforward navigation, complete with detailed, step-by-step guidance.
Key Features
- Comprehensive DCF Calculator: Provides in-depth unlevered and levered DCF valuation models tailored for Mango Excellent Media Co., Ltd. (300413SZ).
- WACC Tool: A pre-configured Weighted Average Cost of Capital sheet with adjustable parameters.
- Customizable Forecast Assumptions: Adjust growth rates, capital expenditures, and discount rates as needed.
- Integrated Financial Ratios: Evaluate profitability, leverage, and efficiency ratios specifically for Mango Excellent Media Co., Ltd. (300413SZ).
- Dashboard and Visualizations: Graphical outputs to summarize essential valuation metrics for straightforward analysis.
How It Operates
- Download the Template: Gain immediate access to the Excel-based Mango Excellent Media Co., Ltd. (300413SZ) DCF Calculator.
- Input Your Assumptions: Modify the yellow-highlighted cells for growth rates, WACC, profit margins, and other key metrics.
- Instant Calculations: The model will automatically refresh to reflect the intrinsic value of Mango Excellent Media Co., Ltd. (300413SZ).
- Test Scenarios: Experiment with different assumptions to assess potential changes in valuation.
- Analyze and Decide: Leverage the outcomes to inform your investment strategies or financial assessments.
Why Choose Mango Excellent Media Co., Ltd. (300413SZ) Calculator?
- All-in-One Solution: Combines DCF, WACC, and financial ratio analyses for comprehensive assessments.
- Flexible Input Options: Modify highlighted cells to explore different financial scenarios.
- In-Depth Analysis: Automatically computes the intrinsic value and Net Present Value for Mango Excellent Media Co., Ltd.
- Preloaded Information: Access to historical and forecasted data for reliable initial values.
- High-Quality Standards: Perfect for financial analysts, investors, and business consultants in the media sector.
Who Can Benefit from This Product?
- Investors: Evaluate Mango Excellent Media Co., Ltd.'s (300413SZ) worthiness before making investment decisions.
- CFOs and Financial Analysts: Optimize valuation methodologies and analyze forecasts effectively.
- Startup Founders: Understand the valuation processes of established companies like Mango Excellent Media Co., Ltd. (300413SZ).
- Consultants: Create comprehensive valuation reports for your clients based on Mango Excellent Media Co., Ltd. (300413SZ).
- Students and Educators: Utilize current data to explore and teach valuation methods related to Mango Excellent Media Co., Ltd. (300413SZ).
Contents of the Template
- Operating and Balance Sheet Data: Pre-filled historical data and forecasts for Mango Excellent Media Co., Ltd. (300413SZ), including revenue, EBITDA, EBIT, and capital expenditures.
- WACC Calculation: A separate sheet for calculating the Weighted Average Cost of Capital (WACC), featuring parameters such as Beta, risk-free rate, and share price.
- DCF Valuation (Unlevered and Levered): Customizable Discounted Cash Flow models that present intrinsic value alongside thorough calculations.
- Financial Statements: Pre-loaded financial statements (both annual and quarterly) to facilitate comprehensive analysis.
- Key Ratios: Includes key profitability, leverage, and efficiency ratios specific to Mango Excellent Media Co., Ltd. (300413SZ).
- Dashboard and Charts: A visual overview of valuation outputs and assumptions for easy analysis of results.
Disclaimer
All information, articles, and product details provided on this website are for general informational and educational purposes only. We do not claim any ownership over, nor do we intend to infringe upon, any trademarks, copyrights, logos, brand names, or other intellectual property mentioned or depicted on this site. Such intellectual property remains the property of its respective owners, and any references here are made solely for identification or informational purposes, without implying any affiliation, endorsement, or partnership.
We make no representations or warranties, express or implied, regarding the accuracy, completeness, or suitability of any content or products presented. Nothing on this website should be construed as legal, tax, investment, financial, medical, or other professional advice. In addition, no part of this site—including articles or product references—constitutes a solicitation, recommendation, endorsement, advertisement, or offer to buy or sell any securities, franchises, or other financial instruments, particularly in jurisdictions where such activity would be unlawful.
All content is of a general nature and may not address the specific circumstances of any individual or entity. It is not a substitute for professional advice or services. Any actions you take based on the information provided here are strictly at your own risk. You accept full responsibility for any decisions or outcomes arising from your use of this website and agree to release us from any liability in connection with your use of, or reliance upon, the content or products found herein.