
|
Changzhou Tronly New Electronic Materials Co., Ltd. (300429.SZ) Avaliação DCF |
Totalmente Editável: Adapte-Se Às Suas Necessidades No Excel Ou Planilhas
Design Profissional: Modelos Confiáveis E Padrão Da Indústria
Pré-Construídos Para Uso Rápido E Eficiente
Compatível com MAC/PC, totalmente desbloqueado
Não É Necessária Experiência; Fácil De Seguir
Changzhou Tronly New Electronic Materials Co., Ltd. (300429.SZ) Bundle
Procurando avaliar o valor intrínseco da Changzhou Tronly New Electronic Materials Co., Ltd.? Nossa calculadora DCF (300429SZ) integra dados do mundo real com extensos recursos de personalização, permitindo ajustar as previsões e aprimorar suas estratégias de investimento.
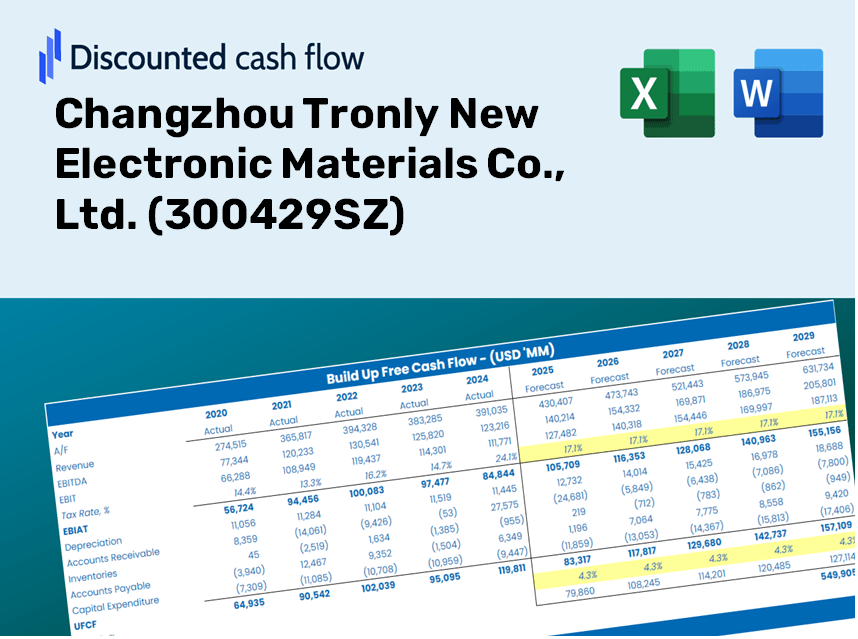
Discounted Cash Flow (DCF) - (USD MM)
| Year | AY1 2020 |
AY2 2021 |
AY3 2022 |
AY4 2023 |
AY5 2024 |
FY1 2025 |
FY2 2026 |
FY3 2027 |
FY4 2028 |
FY5 2029 |
|---|---|---|---|---|---|---|---|---|---|---|
| Revenue | 776.5 | 1,038.7 | 891.0 | 797.1 | 924.1 | 981.7 | 1,042.9 | 1,108.0 | 1,177.1 | 1,250.5 |
| Revenue Growth, % | 0 | 33.77 | -14.22 | -10.54 | 15.93 | 6.24 | 6.24 | 6.24 | 6.24 | 6.24 |
| EBITDA | 167.6 | 226.6 | 36.9 | 124.9 | 38.3 | 132.2 | 140.5 | 149.2 | 158.5 | 168.4 |
| EBITDA, % | 21.58 | 21.81 | 4.14 | 15.66 | 4.15 | 13.47 | 13.47 | 13.47 | 13.47 | 13.47 |
| Depreciation | 66.2 | 77.0 | 116.3 | 118.3 | 157.9 | 119.6 | 127.1 | 135.0 | 143.4 | 152.4 |
| Depreciation, % | 8.53 | 7.41 | 13.05 | 14.85 | 17.09 | 12.18 | 12.18 | 12.18 | 12.18 | 12.18 |
| EBIT | 101.4 | 149.6 | -79.4 | 6.5 | -119.6 | 12.6 | 13.4 | 14.2 | 15.1 | 16.1 |
| EBIT, % | 13.05 | 14.4 | -8.91 | 0.81884 | -12.94 | 1.28 | 1.28 | 1.28 | 1.28 | 1.28 |
| Total Cash | 1,187.9 | 1,108.3 | 670.5 | 450.4 | 219.0 | 697.9 | 741.4 | 787.7 | 836.8 | 889.0 |
| Total Cash, percent | .0 | .0 | .0 | .0 | .0 | .0 | .0 | .0 | .0 | .0 |
| Account Receivables | 172.8 | 222.8 | 142.1 | 151.8 | 198.5 | 196.7 | 208.9 | 222.0 | 235.8 | 250.5 |
| Account Receivables, % | 22.25 | 21.45 | 15.95 | 19.04 | 21.49 | 20.03 | 20.03 | 20.03 | 20.03 | 20.03 |
| Inventories | 258.4 | 363.0 | 408.0 | 401.4 | 416.9 | 411.3 | 437.0 | 464.2 | 493.2 | 523.9 |
| Inventories, % | 33.28 | 34.95 | 45.79 | 50.35 | 45.12 | 41.9 | 41.9 | 41.9 | 41.9 | 41.9 |
| Accounts Payable | 71.5 | 12.1 | 118.0 | 204.5 | 240.1 | 147.8 | 157.0 | 166.8 | 177.2 | 188.2 |
| Accounts Payable, % | 9.21 | 1.16 | 13.25 | 25.66 | 25.98 | 15.05 | 15.05 | 15.05 | 15.05 | 15.05 |
| Capital Expenditure | -203.5 | -378.5 | -499.5 | -387.9 | -215.4 | -374.4 | -397.7 | -422.5 | -448.9 | -476.9 |
| Capital Expenditure, % | -26.21 | -36.44 | -56.05 | -48.67 | -23.31 | -38.14 | -38.14 | -38.14 | -38.14 | -38.14 |
| Tax Rate, % | -2.22 | -2.22 | -2.22 | -2.22 | -2.22 | -2.22 | -2.22 | -2.22 | -2.22 | -2.22 |
| EBITAT | 90.7 | 132.3 | -69.9 | 6.3 | -122.2 | 11.7 | 12.4 | 13.2 | 14.0 | 14.9 |
| Depreciation | ||||||||||
| Changes in Account Receivables | ||||||||||
| Changes in Inventories | ||||||||||
| Changes in Accounts Payable | ||||||||||
| Capital Expenditure | ||||||||||
| UFCF | -406.3 | -383.3 | -311.4 | -179.9 | -206.6 | -327.9 | -287.0 | -304.9 | -323.9 | -344.1 |
| WACC, % | 5.53 | 5.52 | 5.52 | 5.56 | 5.58 | 5.54 | 5.54 | 5.54 | 5.54 | 5.54 |
| PV UFCF | ||||||||||
| SUM PV UFCF | -1,351.5 | |||||||||
| Long Term Growth Rate, % | 2.00 | |||||||||
| Free cash flow (T + 1) | -351 | |||||||||
| Terminal Value | -9,909 | |||||||||
| Present Terminal Value | -7,566 | |||||||||
| Enterprise Value | -8,918 | |||||||||
| Net Debt | 776 | |||||||||
| Equity Value | -9,694 | |||||||||
| Diluted Shares Outstanding, MM | 688 | |||||||||
| Equity Value Per Share | -14.09 |
What You Will Receive
- Comprehensive Financial Model: Leverage actual data from Changzhou Tronly New Electronic Materials Co., Ltd. (300429SZ) for accurate DCF valuation.
- Complete Forecast Control: Modify revenue growth, profit margins, WACC, and other essential drivers.
- Real-Time Calculations: Instantaneous updates provide immediate feedback as you make adjustments.
- Professional-Grade Template: A polished Excel file crafted for high-quality valuation needs.
- Versatile and Easily Customizable: Designed for adaptability, enabling repeated use for in-depth forecasting.
Key Features
- Customizable Forecast Inputs: Adjust essential parameters such as revenue growth, EBITDA %, and capital investments.
- Instant DCF Valuation: Automatically determines intrinsic value, NPV, and other financial metrics in real-time.
- High-Precision Accuracy: Leverages real-world financial data specific to Changzhou Tronly New Electronic Materials Co., Ltd. (300429SZ) for realistic valuation results.
- Streamlined Scenario Analysis: Easily explore various assumptions and assess their outcomes without hassle.
- Efficiency-Enhancing Tool: Remove the complexity of constructing intricate valuation models from the ground up.
How It Functions
- Step 1: Download the Excel file for Changzhou Tronly New Electronic Materials Co., Ltd. (300429SZ).
- Step 2: Examine the pre-filled data on Changzhou Tronly (historical and projected).
- Step 3: Modify key assumptions (highlighted in yellow) based on your analysis.
- Step 4: Observe the automatic recalculations for the intrinsic value of Changzhou Tronly (300429SZ).
- Step 5: Utilize the results for investment strategies or reporting purposes.
Why Select This Calculator for Changzhou Tronly New Electronic Materials Co., Ltd. (300429SZ)?
- Reliable Data: Utilizes authentic financial figures from Changzhou Tronly for trustworthy valuation outcomes.
- Flexible Options: Tailor essential inputs such as growth projections, WACC, and tax rates to align with your forecasts.
- Efficiency: Built-in calculations save you time and eliminate the hassle of starting from scratch.
- Professional Quality: Crafted for investors, analysts, and consultants seeking precise insights.
- User-Friendly Design: With an intuitive interface and clear, step-by-step guidance, it's accessible for all users.
Who Can Benefit from Changzhou Tronly New Electronic Materials Co., Ltd. (300429SZ)?
- Investors: Gain valuable insights and make informed decisions with our advanced electronic materials.
- Manufacturers: Enhance production efficiency using our high-quality materials tailored for various applications.
- Researchers: Access cutting-edge materials for innovative projects and experiments in electronics.
- Distributors: Expand your product offerings with our reliable and high-demand electronic materials.
- Educators and Students: Utilize our materials as a practical resource for hands-on learning in electronics and materials science.
Contents of the Template
- Operating and Balance Sheet Data: Pre-filled historical data and forecasts for Changzhou Tronly New Electronic Materials Co., Ltd. (300429SZ), including revenue, EBITDA, EBIT, and capital expenditures.
- WACC Calculation: A dedicated worksheet for calculating the Weighted Average Cost of Capital (WACC), featuring parameters such as Beta, risk-free rate, and share price.
- DCF Valuation (Unlevered and Levered): Customizable Discounted Cash Flow models that present intrinsic value along with comprehensive calculations.
- Financial Statements: Pre-loaded annual and quarterly financial statements for thorough analysis.
- Key Ratios: A collection of profitability, leverage, and efficiency ratios specifically for Changzhou Tronly New Electronic Materials Co., Ltd. (300429SZ).
- Dashboard and Charts: A visual summary of valuation outputs and assumptions to facilitate easy analysis of results.
Disclaimer
All information, articles, and product details provided on this website are for general informational and educational purposes only. We do not claim any ownership over, nor do we intend to infringe upon, any trademarks, copyrights, logos, brand names, or other intellectual property mentioned or depicted on this site. Such intellectual property remains the property of its respective owners, and any references here are made solely for identification or informational purposes, without implying any affiliation, endorsement, or partnership.
We make no representations or warranties, express or implied, regarding the accuracy, completeness, or suitability of any content or products presented. Nothing on this website should be construed as legal, tax, investment, financial, medical, or other professional advice. In addition, no part of this site—including articles or product references—constitutes a solicitation, recommendation, endorsement, advertisement, or offer to buy or sell any securities, franchises, or other financial instruments, particularly in jurisdictions where such activity would be unlawful.
All content is of a general nature and may not address the specific circumstances of any individual or entity. It is not a substitute for professional advice or services. Any actions you take based on the information provided here are strictly at your own risk. You accept full responsibility for any decisions or outcomes arising from your use of this website and agree to release us from any liability in connection with your use of, or reliance upon, the content or products found herein.