
|
Ningbo Baosi Energy Equipment Co., Ltd. (300441.sz) Avaliação DCF |
Totalmente Editável: Adapte-Se Às Suas Necessidades No Excel Ou Planilhas
Design Profissional: Modelos Confiáveis E Padrão Da Indústria
Pré-Construídos Para Uso Rápido E Eficiente
Compatível com MAC/PC, totalmente desbloqueado
Não É Necessária Experiência; Fácil De Seguir
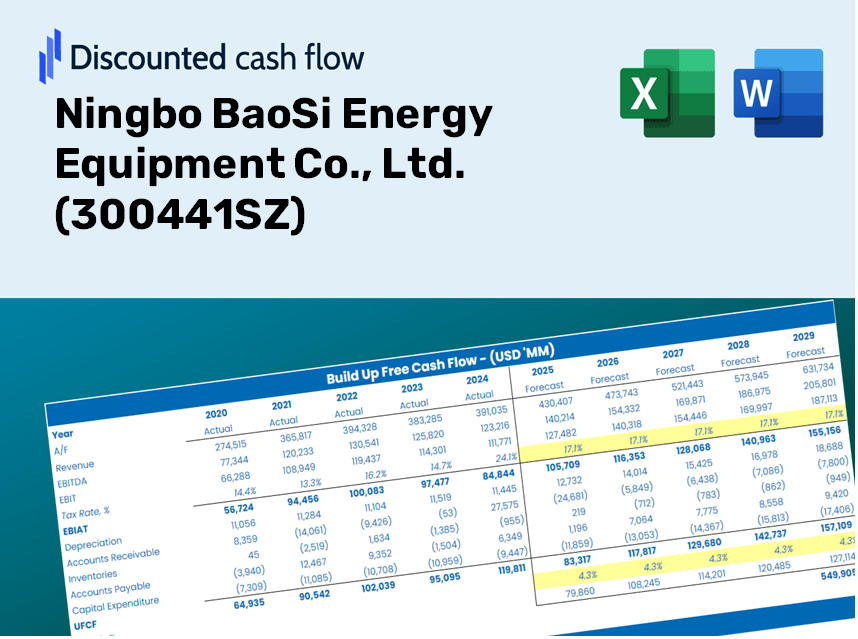
Ningbo BaoSi Energy Equipment Co., Ltd. (300441.SZ) Bundle
Simplifique a avaliação Ningbo Baosi Energy Equipment Co., Ltd. (300441SZ) com esta calculadora DCF personalizável! Com o Real Ningbo Baosi Energy Equipment Co., Ltd. (300441SZ) e entradas de previsão ajustáveis, você pode testar cenários e descobrir o valor justo Ningbo Baosi Energy Equipment Co., Ltd. (300441SZ) em minutos.
Discounted Cash Flow (DCF) - (USD MM)
| Year | AY1 2020 |
AY2 2021 |
AY3 2022 |
AY4 2023 |
AY5 2024 |
FY1 2025 |
FY2 2026 |
FY3 2027 |
FY4 2028 |
FY5 2029 |
|---|---|---|---|---|---|---|---|---|---|---|
| Revenue | 1,971.0 | 2,171.8 | 2,054.1 | 2,415.2 | 2,321.1 | 2,428.2 | 2,540.3 | 2,657.5 | 2,780.1 | 2,908.4 |
| Revenue Growth, % | 0 | 10.19 | -5.42 | 17.58 | -3.9 | 4.61 | 4.61 | 4.61 | 4.61 | 4.61 |
| EBITDA | 350.3 | 542.1 | 363.2 | 589.5 | 1,305.5 | 685.1 | 716.7 | 749.8 | 784.4 | 820.6 |
| EBITDA, % | 17.77 | 24.96 | 17.68 | 24.41 | 56.25 | 28.21 | 28.21 | 28.21 | 28.21 | 28.21 |
| Depreciation | 135.7 | 161.2 | 184.6 | 172.4 | 145.8 | 178.3 | 186.5 | 195.1 | 204.1 | 213.6 |
| Depreciation, % | 6.89 | 7.42 | 8.99 | 7.14 | 6.28 | 7.34 | 7.34 | 7.34 | 7.34 | 7.34 |
| EBIT | 214.6 | 380.9 | 178.6 | 417.2 | 1,159.7 | 506.8 | 530.2 | 554.6 | 580.2 | 607.0 |
| EBIT, % | 10.89 | 17.54 | 8.69 | 17.27 | 49.96 | 20.87 | 20.87 | 20.87 | 20.87 | 20.87 |
| Total Cash | 235.0 | 346.0 | 311.4 | 333.8 | 490.2 | 378.6 | 396.0 | 414.3 | 433.4 | 453.4 |
| Total Cash, percent | .0 | .0 | .0 | .0 | .0 | .0 | .0 | .0 | .0 | .0 |
| Account Receivables | 625.4 | 535.8 | 528.5 | 709.4 | 925.6 | 735.2 | 769.1 | 804.6 | 841.7 | 880.5 |
| Account Receivables, % | 31.73 | 24.67 | 25.73 | 29.37 | 39.87 | 30.28 | 30.28 | 30.28 | 30.28 | 30.28 |
| Inventories | 469.5 | 613.6 | 684.3 | 915.9 | 777.5 | 761.6 | 796.7 | 833.5 | 871.9 | 912.1 |
| Inventories, % | 23.82 | 28.25 | 33.31 | 37.92 | 33.5 | 31.36 | 31.36 | 31.36 | 31.36 | 31.36 |
| Accounts Payable | 359.6 | 291.9 | 276.9 | 394.1 | 269.6 | 355.0 | 371.4 | 388.5 | 406.4 | 425.2 |
| Accounts Payable, % | 18.24 | 13.44 | 13.48 | 16.32 | 11.61 | 14.62 | 14.62 | 14.62 | 14.62 | 14.62 |
| Capital Expenditure | -247.0 | -380.7 | -167.9 | -310.8 | -517.7 | -356.5 | -372.9 | -390.2 | -408.2 | -427.0 |
| Capital Expenditure, % | -12.53 | -17.53 | -8.17 | -12.87 | -22.3 | -14.68 | -14.68 | -14.68 | -14.68 | -14.68 |
| Tax Rate, % | 27.5 | 27.5 | 27.5 | 27.5 | 27.5 | 27.5 | 27.5 | 27.5 | 27.5 | 27.5 |
| EBITAT | 122.2 | 290.9 | 135.0 | 292.7 | 840.8 | 356.4 | 372.8 | 390.0 | 408.0 | 426.8 |
| Depreciation | ||||||||||
| Changes in Account Receivables | ||||||||||
| Changes in Inventories | ||||||||||
| Changes in Accounts Payable | ||||||||||
| Capital Expenditure | ||||||||||
| UFCF | -724.4 | -50.8 | 73.4 | -141.1 | 266.6 | 470.0 | 133.7 | 139.9 | 146.4 | 153.1 |
| WACC, % | 5.49 | 5.53 | 5.53 | 5.51 | 5.52 | 5.52 | 5.52 | 5.52 | 5.52 | 5.52 |
| PV UFCF | ||||||||||
| SUM PV UFCF | 919.8 | |||||||||
| Long Term Growth Rate, % | 2.00 | |||||||||
| Free cash flow (T + 1) | 156 | |||||||||
| Terminal Value | 4,443 | |||||||||
| Present Terminal Value | 3,397 | |||||||||
| Enterprise Value | 4,316 | |||||||||
| Net Debt | -361 | |||||||||
| Equity Value | 4,678 | |||||||||
| Diluted Shares Outstanding, MM | 645 | |||||||||
| Equity Value Per Share | 7.25 |
What You Will Receive
- Authentic BaoSi Data: Comprehensive financials – encompassing revenue to EBIT – derived from actual and projected metrics.
- Complete Customization: Modify all essential parameters (yellow cells) such as WACC, growth %, and tax rates.
- Immediate Valuation Adjustments: Automatic recalculations to evaluate the effects of changes on BaoSi's fair value.
- Dynamic Excel Template: Designed for quick modifications, scenario analysis, and detailed forecasting.
- Efficient and Precise: Avoid the hassle of constructing models from the ground up while ensuring accuracy and adaptability.
Key Features
- 🔍 Real-Life 300441SZ Financials: Pre-filled historical and projected data for Ningbo BaoSi Energy Equipment Co., Ltd.
- ✏️ Fully Customizable Inputs: Modify all essential parameters (yellow cells) such as WACC, growth %, and tax rates.
- 📊 Professional DCF Valuation: Integrated formulas assess Ningbo BaoSi's intrinsic value using the Discounted Cash Flow method.
- ⚡ Instant Results: View Ningbo BaoSi's valuation immediately after adjustments are made.
- Scenario Analysis: Evaluate and contrast results for different financial assumptions side-by-side.
How It Functions
- Download: Obtain the pre-configured Excel file featuring financial data for Ningbo BaoSi Energy Equipment Co., Ltd. (300441SZ).
- Customize: Modify forecasts, such as revenue growth, EBITDA margin, and WACC.
- Update Automatically: The intrinsic value and NPV calculations refresh in real-time.
- Test Scenarios: Generate various projections and instantly compare the results.
- Make Decisions: Utilize the valuation outcomes to inform your investment strategies.
Why Choose This Calculator for Ningbo BaoSi Energy Equipment Co., Ltd. (300441SZ)?
- Designed for Industry Experts: A sophisticated tool tailored for analysts, CFOs, and consultants in the energy sector.
- Accurate Financial Data: Comprehensive historical and projected financials for Ningbo BaoSi preloaded for precise analysis.
- Flexible Scenario Analysis: Effortlessly simulate various forecasts and assumptions to explore different outcomes.
- Insightful Results: Automatically computes intrinsic value, NPV, and essential financial metrics.
- User-Friendly Interface: Step-by-step guidance simplifies the entire calculation process.
Who Can Benefit from This Product?
- Individual Investors: Gain insights to make educated choices regarding investments in Ningbo BaoSi Energy Equipment Co., Ltd. (300441SZ).
- Financial Analysts: Enhance your valuation process with comprehensive financial models tailored for Ningbo BaoSi Energy Equipment Co., Ltd. (300441SZ).
- Consultants: Provide clients with accurate and swift valuation analyses of Ningbo BaoSi Energy Equipment Co., Ltd. (300441SZ).
- Business Owners: Learn about valuation methodologies of prominent companies like Ningbo BaoSi Energy Equipment Co., Ltd. (300441SZ) to inform your business strategy.
- Finance Students: Explore real-world valuation techniques using data and scenarios related to Ningbo BaoSi Energy Equipment Co., Ltd. (300441SZ).
Contents of the Template
- Pre-Filled Data: Contains Ningbo BaoSi Energy Equipment Co., Ltd.'s historical financials and projections.
- Discounted Cash Flow Model: An editable DCF valuation model with automated calculations.
- Weighted Average Cost of Capital (WACC): A dedicated sheet for determining WACC using tailored inputs.
- Key Financial Ratios: Assess Ningbo BaoSi's profitability, operational efficiency, and financial leverage.
- Customizable Inputs: Easily modify revenue growth rates, profit margins, and tax assumptions.
- Clear Dashboard: Visual representations and tables highlighting essential valuation outcomes.
Disclaimer
All information, articles, and product details provided on this website are for general informational and educational purposes only. We do not claim any ownership over, nor do we intend to infringe upon, any trademarks, copyrights, logos, brand names, or other intellectual property mentioned or depicted on this site. Such intellectual property remains the property of its respective owners, and any references here are made solely for identification or informational purposes, without implying any affiliation, endorsement, or partnership.
We make no representations or warranties, express or implied, regarding the accuracy, completeness, or suitability of any content or products presented. Nothing on this website should be construed as legal, tax, investment, financial, medical, or other professional advice. In addition, no part of this site—including articles or product references—constitutes a solicitation, recommendation, endorsement, advertisement, or offer to buy or sell any securities, franchises, or other financial instruments, particularly in jurisdictions where such activity would be unlawful.
All content is of a general nature and may not address the specific circumstances of any individual or entity. It is not a substitute for professional advice or services. Any actions you take based on the information provided here are strictly at your own risk. You accept full responsibility for any decisions or outcomes arising from your use of this website and agree to release us from any liability in connection with your use of, or reliance upon, the content or products found herein.