
|
AllwinnerTech Technology Co., Ltd. (300458.sz) Avaliação DCF |
Totalmente Editável: Adapte-Se Às Suas Necessidades No Excel Ou Planilhas
Design Profissional: Modelos Confiáveis E Padrão Da Indústria
Pré-Construídos Para Uso Rápido E Eficiente
Compatível com MAC/PC, totalmente desbloqueado
Não É Necessária Experiência; Fácil De Seguir
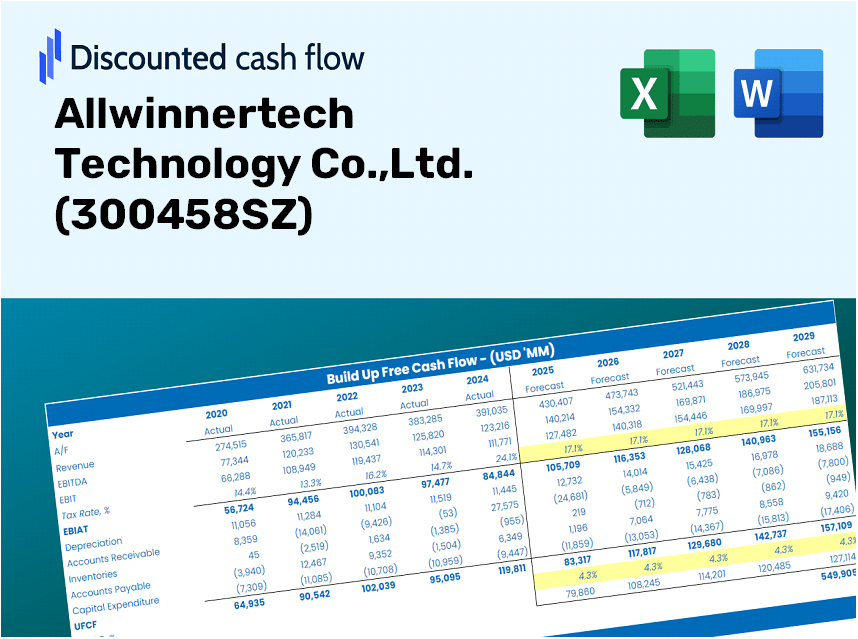
Allwinnertech Technology Co.,Ltd. (300458.SZ) Bundle
Procurando avaliar o valor intrínseco da AllwinnerTech Technology Co., Ltd.? Nossa calculadora DCF (300458SZ) integra dados do mundo real com extensos recursos de personalização, permitindo refinar suas previsões e aprimorar suas opções de investimento.
Discounted Cash Flow (DCF) - (USD MM)
| Year | AY1 2020 |
AY2 2021 |
AY3 2022 |
AY4 2023 |
AY5 2024 |
FY1 2025 |
FY2 2026 |
FY3 2027 |
FY4 2028 |
FY5 2029 |
|---|---|---|---|---|---|---|---|---|---|---|
| Revenue | 1,505.5 | 2,065.4 | 1,514.1 | 1,673.0 | 2,287.9 | 2,618.2 | 2,996.2 | 3,428.7 | 3,923.7 | 4,490.2 |
| Revenue Growth, % | 0 | 37.19 | -26.69 | 10.49 | 36.76 | 14.44 | 14.44 | 14.44 | 14.44 | 14.44 |
| EBITDA | 132.2 | 389.0 | 164.8 | 60.2 | 152.9 | 255.5 | 292.3 | 334.5 | 382.8 | 438.1 |
| EBITDA, % | 8.78 | 18.83 | 10.89 | 3.6 | 6.68 | 9.76 | 9.76 | 9.76 | 9.76 | 9.76 |
| Depreciation | 58.4 | 78.5 | 98.1 | 114.2 | 83.8 | 129.1 | 147.7 | 169.0 | 193.4 | 221.4 |
| Depreciation, % | 3.88 | 3.8 | 6.48 | 6.83 | 3.66 | 4.93 | 4.93 | 4.93 | 4.93 | 4.93 |
| EBIT | 73.8 | 310.4 | 66.8 | -54.0 | 69.1 | 126.4 | 144.6 | 165.5 | 189.4 | 216.8 |
| EBIT, % | 4.9 | 15.03 | 4.41 | -3.23 | 3.02 | 4.83 | 4.83 | 4.83 | 4.83 | 4.83 |
| Total Cash | 1,886.9 | 2,129.4 | 1,701.0 | 1,878.5 | 1,890.7 | 2,527.3 | 2,892.2 | 3,309.7 | 3,787.5 | 4,334.3 |
| Total Cash, percent | .0 | .0 | .0 | .0 | .0 | .0 | .0 | .0 | .0 | .0 |
| Account Receivables | 36.9 | 24.2 | 50.9 | 59.6 | 42.0 | 64.8 | 74.2 | 84.9 | 97.2 | 111.2 |
| Account Receivables, % | 2.45 | 1.17 | 3.36 | 3.56 | 1.83 | 2.48 | 2.48 | 2.48 | 2.48 | 2.48 |
| Inventories | 309.3 | 478.9 | 573.5 | 435.4 | 557.4 | 691.2 | 791.0 | 905.2 | 1,035.9 | 1,185.4 |
| Inventories, % | 20.55 | 23.19 | 37.88 | 26.02 | 24.36 | 26.4 | 26.4 | 26.4 | 26.4 | 26.4 |
| Accounts Payable | 178.1 | 188.5 | 305.5 | 193.2 | 153.3 | 311.0 | 355.8 | 407.2 | 466.0 | 533.3 |
| Accounts Payable, % | 11.83 | 9.13 | 20.17 | 11.55 | 6.7 | 11.88 | 11.88 | 11.88 | 11.88 | 11.88 |
| Capital Expenditure | -30.2 | -182.2 | -94.9 | -83.8 | -120.2 | -143.2 | -163.9 | -187.6 | -214.7 | -245.7 |
| Capital Expenditure, % | -2.01 | -8.82 | -6.27 | -5.01 | -5.25 | -5.47 | -5.47 | -5.47 | -5.47 | -5.47 |
| Tax Rate, % | -1.26 | -1.26 | -1.26 | -1.26 | -1.26 | -1.26 | -1.26 | -1.26 | -1.26 | -1.26 |
| EBITAT | 71.1 | 303.4 | 64.0 | -69.1 | 70.0 | 123.9 | 141.7 | 162.2 | 185.6 | 212.4 |
| Depreciation | ||||||||||
| Changes in Account Receivables | ||||||||||
| Changes in Inventories | ||||||||||
| Changes in Accounts Payable | ||||||||||
| Capital Expenditure | ||||||||||
| UFCF | -68.7 | 53.2 | 62.9 | -21.6 | -110.6 | 110.6 | 61.3 | 70.1 | 80.2 | 91.8 |
| WACC, % | 4.84 | 4.84 | 4.83 | 4.84 | 4.84 | 4.84 | 4.84 | 4.84 | 4.84 | 4.84 |
| PV UFCF | ||||||||||
| SUM PV UFCF | 361.0 | |||||||||
| Long Term Growth Rate, % | 4.00 | |||||||||
| Free cash flow (T + 1) | 95 | |||||||||
| Terminal Value | 11,429 | |||||||||
| Present Terminal Value | 9,026 | |||||||||
| Enterprise Value | 9,387 | |||||||||
| Net Debt | -1,635 | |||||||||
| Equity Value | 11,022 | |||||||||
| Diluted Shares Outstanding, MM | 834 | |||||||||
| Equity Value Per Share | 13.22 |
What You'll Receive
- Flexible Input Options: Effortlessly adjust key parameters (growth %, margins, WACC) to generate various scenarios.
- Pre-filled Market Data: Allwinnertech’s financial metrics included to kickstart your analysis.
- Automated DCF Calculations: The template computes Net Present Value (NPV) and intrinsic value automatically.
- Customizable and Professional Design: A sleek Excel model tailored to meet your valuation requirements.
- Designed for Analysts and Investors: Perfect for analyzing projections, validating strategies, and enhancing efficiency.
Key Features
- Comprehensive Financial Data: Gain access to precise historical figures and future forecasts for Allwinnertech Technology Co., Ltd. (300458SZ).
- Flexible Forecast Assumptions: Modify highlighted fields such as WACC, growth rates, and profit margins to suit your analysis.
- Real-Time Calculations: Enjoy automatic updates for DCF, Net Present Value (NPV), and cash flow assessments.
- Interactive Dashboard: Utilize clear charts and summaries for effortless visualization of your valuation outcomes.
- Designed for All Skill Levels: An intuitive layout ideal for investors, CFOs, and consultants alike.
How It Functions
- Download the Template: Gain immediate access to the Excel-based Allwinnertech DCF Calculator.
- Input Your Assumptions: Modify the yellow-highlighted cells for growth rates, WACC, profit margins, and other variables.
- Automatic Calculations: The model dynamically updates Allwinnertech's intrinsic value.
- Explore Scenarios: Test various assumptions to assess potential changes in valuation.
- Evaluate and Decide: Utilize the results to inform your investment or financial assessment for Allwinnertech (300458SZ).
Why Opt for Allwinnertech’s Calculator?
- Reliable Information: Utilize authentic Allwinnertech financial data for precise valuation outcomes.
- Tailorable: Modify essential variables such as growth rates, WACC, and tax rates to align with your forecasts.
- Efficiency Boost: Ready-made calculations save you the hassle of building from the ground up.
- Expert-Level Resource: Crafted for investors, analysts, and consultants in the field.
- User-Centric: Clear design and guided steps ensure accessibility for all users.
Who Should Consider Using Allwinnertech's Solutions?
- Professional Investors: Develop comprehensive and trustworthy valuation models for thorough portfolio assessments involving Allwinnertech (300458SZ).
- Corporate Finance Departments: Evaluate valuation scenarios to inform strategic decisions within their organizations related to Allwinnertech (300458SZ).
- Consultants and Advisors: Equip clients with precise valuation insights concerning Allwinnertech (300458SZ) stock.
- Students and Educators: Leverage real-world data to practice and teach financial modeling techniques with a focus on Allwinnertech (300458SZ).
- Tech Enthusiasts: Gain insight into how technology companies like Allwinnertech (300458SZ) are assessed in the market.
Contents of the Template
- Operating and Balance Sheet Data: Pre-filled historical data and forecasts for Allwinnertech Technology Co., Ltd. (300458SZ), including revenue, EBITDA, EBIT, and capital expenditures.
- WACC Calculation: A dedicated sheet for calculating the Weighted Average Cost of Capital (WACC), featuring parameters such as Beta, risk-free rate, and share price.
- DCF Valuation (Unlevered and Levered): Customizable Discounted Cash Flow models that detail intrinsic value along with comprehensive calculations.
- Financial Statements: Pre-loaded financial statements (both annual and quarterly) designed to facilitate thorough analysis.
- Key Ratios: A collection of profitability, leverage, and efficiency ratios specifically for Allwinnertech Technology Co., Ltd. (300458SZ).
- Dashboard and Charts: A visual summary of valuation outputs and assumptions to simplify result analysis.
Disclaimer
All information, articles, and product details provided on this website are for general informational and educational purposes only. We do not claim any ownership over, nor do we intend to infringe upon, any trademarks, copyrights, logos, brand names, or other intellectual property mentioned or depicted on this site. Such intellectual property remains the property of its respective owners, and any references here are made solely for identification or informational purposes, without implying any affiliation, endorsement, or partnership.
We make no representations or warranties, express or implied, regarding the accuracy, completeness, or suitability of any content or products presented. Nothing on this website should be construed as legal, tax, investment, financial, medical, or other professional advice. In addition, no part of this site—including articles or product references—constitutes a solicitation, recommendation, endorsement, advertisement, or offer to buy or sell any securities, franchises, or other financial instruments, particularly in jurisdictions where such activity would be unlawful.
All content is of a general nature and may not address the specific circumstances of any individual or entity. It is not a substitute for professional advice or services. Any actions you take based on the information provided here are strictly at your own risk. You accept full responsibility for any decisions or outcomes arising from your use of this website and agree to release us from any liability in connection with your use of, or reliance upon, the content or products found herein.