
|
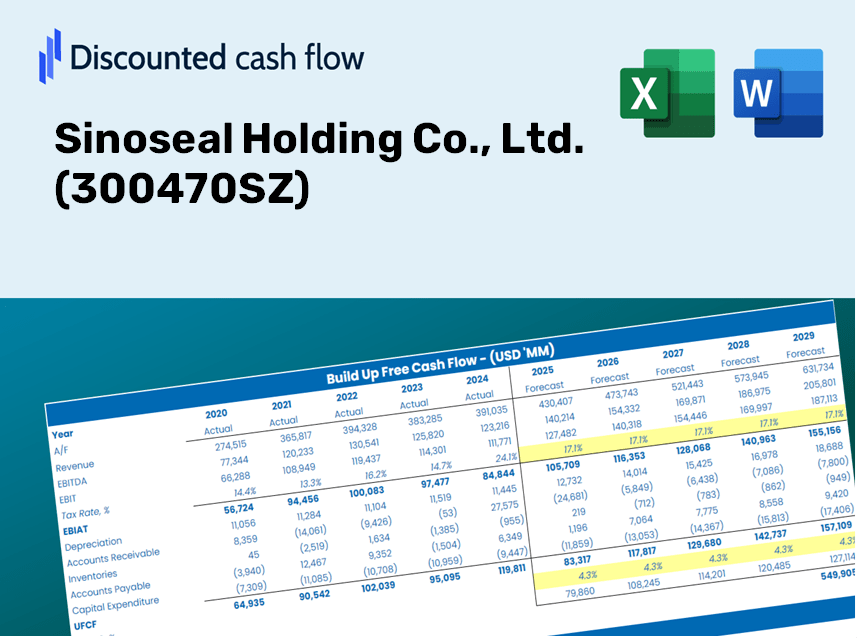
Sinoseal Holding Co., Ltd. (300470.sz) Avaliação DCF |
Totalmente Editável: Adapte-Se Às Suas Necessidades No Excel Ou Planilhas
Design Profissional: Modelos Confiáveis E Padrão Da Indústria
Pré-Construídos Para Uso Rápido E Eficiente
Compatível com MAC/PC, totalmente desbloqueado
Não É Necessária Experiência; Fácil De Seguir
Sinoseal Holding Co., Ltd. (300470.SZ) Bundle
Otimize seu tempo e melhore a precisão com a nossa calculadora DCF (300470SZ)! Utilizando dados reais da Sinoseal Holding Co., Ltd. e suposições personalizáveis, essa ferramenta o capacita a prever, analisar e valorizar sinoseal como um investidor experiente.
Discounted Cash Flow (DCF) - (USD MM)
| Year | AY1 2020 |
AY2 2021 |
AY3 2022 |
AY4 2023 |
AY5 2024 |
FY1 2025 |
FY2 2026 |
FY3 2027 |
FY4 2028 |
FY5 2029 |
|---|---|---|---|---|---|---|---|---|---|---|
| Revenue | 924.3 | 1,131.6 | 1,214.7 | 1,369.4 | 1,566.5 | 1,789.4 | 2,043.9 | 2,334.7 | 2,666.8 | 3,046.1 |
| Revenue Growth, % | 0 | 22.43 | 7.34 | 12.73 | 14.4 | 14.23 | 14.23 | 14.23 | 14.23 | 14.23 |
| EBITDA | 252.3 | 337.3 | 372.5 | 406.5 | 459.6 | 525.4 | 600.1 | 685.5 | 783.0 | 894.3 |
| EBITDA, % | 27.3 | 29.81 | 30.66 | 29.69 | 29.34 | 29.36 | 29.36 | 29.36 | 29.36 | 29.36 |
| Depreciation | 30.5 | 39.6 | 45.1 | 44.5 | 44.2 | 59.3 | 67.8 | 77.4 | 88.4 | 101.0 |
| Depreciation, % | 3.3 | 3.5 | 3.72 | 3.25 | 2.82 | 3.32 | 3.32 | 3.32 | 3.32 | 3.32 |
| EBIT | 221.9 | 297.7 | 327.3 | 362.1 | 415.4 | 466.0 | 532.3 | 608.0 | 694.5 | 793.3 |
| EBIT, % | 24 | 26.31 | 26.95 | 26.44 | 26.52 | 26.04 | 26.04 | 26.04 | 26.04 | 26.04 |
| Total Cash | 895.9 | 952.1 | 982.1 | 1,004.9 | 810.1 | 1,385.1 | 1,582.1 | 1,807.1 | 2,064.2 | 2,357.8 |
| Total Cash, percent | .0 | .0 | .0 | .0 | .0 | .0 | .0 | .0 | .0 | .0 |
| Account Receivables | 681.0 | 760.4 | 811.9 | 837.3 | 807.8 | 1,146.8 | 1,309.9 | 1,496.2 | 1,709.1 | 1,952.2 |
| Account Receivables, % | 73.68 | 67.2 | 66.84 | 61.15 | 51.57 | 64.09 | 64.09 | 64.09 | 64.09 | 64.09 |
| Inventories | 242.8 | 314.5 | 327.5 | 413.3 | 465.4 | 504.3 | 576.1 | 658.0 | 751.6 | 858.5 |
| Inventories, % | 26.27 | 27.8 | 26.96 | 30.19 | 29.71 | 28.18 | 28.18 | 28.18 | 28.18 | 28.18 |
| Accounts Payable | 137.3 | 187.1 | 191.1 | 278.0 | 247.1 | 297.8 | 340.1 | 388.5 | 443.8 | 506.9 |
| Accounts Payable, % | 14.86 | 16.54 | 15.73 | 20.3 | 15.77 | 16.64 | 16.64 | 16.64 | 16.64 | 16.64 |
| Capital Expenditure | -16.4 | -35.4 | -60.4 | -71.5 | -59.7 | -67.7 | -77.3 | -88.3 | -100.9 | -115.2 |
| Capital Expenditure, % | -1.77 | -3.13 | -4.97 | -5.22 | -3.81 | -3.78 | -3.78 | -3.78 | -3.78 | -3.78 |
| Tax Rate, % | 12.27 | 12.27 | 12.27 | 12.27 | 12.27 | 12.27 | 12.27 | 12.27 | 12.27 | 12.27 |
| EBITAT | 191.0 | 257.8 | 285.0 | 312.8 | 364.5 | 404.4 | 461.9 | 527.6 | 602.7 | 688.4 |
| Depreciation | ||||||||||
| Changes in Account Receivables | ||||||||||
| Changes in Inventories | ||||||||||
| Changes in Accounts Payable | ||||||||||
| Capital Expenditure | ||||||||||
| UFCF | -581.3 | 160.6 | 209.1 | 261.5 | 295.4 | 68.9 | 259.9 | 296.8 | 339.1 | 387.3 |
| WACC, % | 5.37 | 5.37 | 5.37 | 5.37 | 5.37 | 5.37 | 5.37 | 5.37 | 5.37 | 5.37 |
| PV UFCF | ||||||||||
| SUM PV UFCF | 1,126.6 | |||||||||
| Long Term Growth Rate, % | 3.00 | |||||||||
| Free cash flow (T + 1) | 399 | |||||||||
| Terminal Value | 16,864 | |||||||||
| Present Terminal Value | 12,986 | |||||||||
| Enterprise Value | 14,113 | |||||||||
| Net Debt | -392 | |||||||||
| Equity Value | 14,505 | |||||||||
| Diluted Shares Outstanding, MM | 204 | |||||||||
| Equity Value Per Share | 71.02 |
What You Will Receive
- Adjustable Forecast Inputs: Effortlessly modify key assumptions (growth %, margins, WACC) to develop various scenarios.
- Comprehensive Data: Sinoseal Holding Co., Ltd.’s (300470SZ) financial data pre-loaded to facilitate your analysis.
- Instant DCF Results: The model automatically calculates Net Present Value (NPV) and intrinsic value for you.
- Tailored and Professional Design: A refined Excel model customized to fit your valuation requirements.
- Designed for Analysts and Investors: Perfect for evaluating projections, confirming strategies, and enhancing efficiency.
Key Features
- 🔍 Real-Life (300470SZ) Financials: Pre-filled historical and projected data for Sinoseal Holding Co., Ltd.
- ✏️ Fully Customizable Inputs: Adjust all critical parameters (yellow cells) like WACC, growth %, and tax rates.
- 📊 Professional DCF Valuation: Built-in formulas calculate Sinoseal's intrinsic value using the Discounted Cash Flow method.
- ⚡ Instant Results: Visualize Sinoseal's valuation instantly after making changes.
- Scenario Analysis: Test and compare outcomes for various financial assumptions side-by-side.
How It Functions
- Download: Obtain the pre-configured Excel file containing Sinoseal Holding Co., Ltd.'s financial metrics.
- Customize: Tailor projections such as revenue growth, EBITDA percentages, and WACC to your needs.
- Automatic Updates: Enjoy real-time updates for intrinsic value and NPV calculations.
- Scenario Testing: Develop various forecasts and instantly compare different outcomes.
- Informed Decisions: Leverage the valuation findings to shape your investment approach.
Why Choose This Calculator for Sinoseal Holding Co., Ltd. (300470SZ)?
- User-Friendly Interface: Suitable for both novices and seasoned professionals.
- Customizable Inputs: Adjust parameters effortlessly to suit your financial analysis.
- Real-Time Valuation Updates: Witness immediate shifts in Sinoseal's valuation as you tweak the variables.
- Preloaded Financial Data: Comes with Sinoseal's actual financial information for swift evaluations.
- Relied Upon by Experts: Favored by investors and analysts for making strategic decisions.
Who Can Benefit from This Product?
- Institutional Investors: Develop comprehensive and dependable valuation models to enhance portfolio assessments for Sinoseal Holding Co., Ltd. (300470SZ).
- Corporate Finance Departments: Evaluate various valuation scenarios to inform strategic decisions within the organization.
- Consultants and Financial Advisors: Equip clients with precise valuation analyses for Sinoseal Holding Co., Ltd. (300470SZ) stock.
- Students and Educators: Leverage real data to enrich learning and practice in financial modeling.
- Industry Analysts: Gain insights into how companies like Sinoseal Holding Co., Ltd. (300470SZ) are valued in today’s market.
Contents of the Template
- Pre-Filled DCF Model: Sinoseal Holding Co., Ltd.'s (300470SZ) financial data preloaded for immediate analysis.
- WACC Calculator: Comprehensive calculations for the Weighted Average Cost of Capital.
- Financial Ratios: Assess Sinoseal's (300470SZ) profitability, leverage, and operational efficiency.
- Customizable Inputs: Modify assumptions like growth rates, margins, and CAPEX to suit your analysis.
- Financial Statements: Annual and quarterly reports to facilitate in-depth evaluation.
- Interactive Dashboard: Effortlessly visualize key valuation metrics and outcomes.
Disclaimer
All information, articles, and product details provided on this website are for general informational and educational purposes only. We do not claim any ownership over, nor do we intend to infringe upon, any trademarks, copyrights, logos, brand names, or other intellectual property mentioned or depicted on this site. Such intellectual property remains the property of its respective owners, and any references here are made solely for identification or informational purposes, without implying any affiliation, endorsement, or partnership.
We make no representations or warranties, express or implied, regarding the accuracy, completeness, or suitability of any content or products presented. Nothing on this website should be construed as legal, tax, investment, financial, medical, or other professional advice. In addition, no part of this site—including articles or product references—constitutes a solicitation, recommendation, endorsement, advertisement, or offer to buy or sell any securities, franchises, or other financial instruments, particularly in jurisdictions where such activity would be unlawful.
All content is of a general nature and may not address the specific circumstances of any individual or entity. It is not a substitute for professional advice or services. Any actions you take based on the information provided here are strictly at your own risk. You accept full responsibility for any decisions or outcomes arising from your use of this website and agree to release us from any liability in connection with your use of, or reliance upon, the content or products found herein.