
|
GL Tech Co., Ltd (300480.sz) Avaliação DCF |
Totalmente Editável: Adapte-Se Às Suas Necessidades No Excel Ou Planilhas
Design Profissional: Modelos Confiáveis E Padrão Da Indústria
Pré-Construídos Para Uso Rápido E Eficiente
Compatível com MAC/PC, totalmente desbloqueado
Não É Necessária Experiência; Fácil De Seguir
GL Tech Co.,Ltd (300480.SZ) Bundle
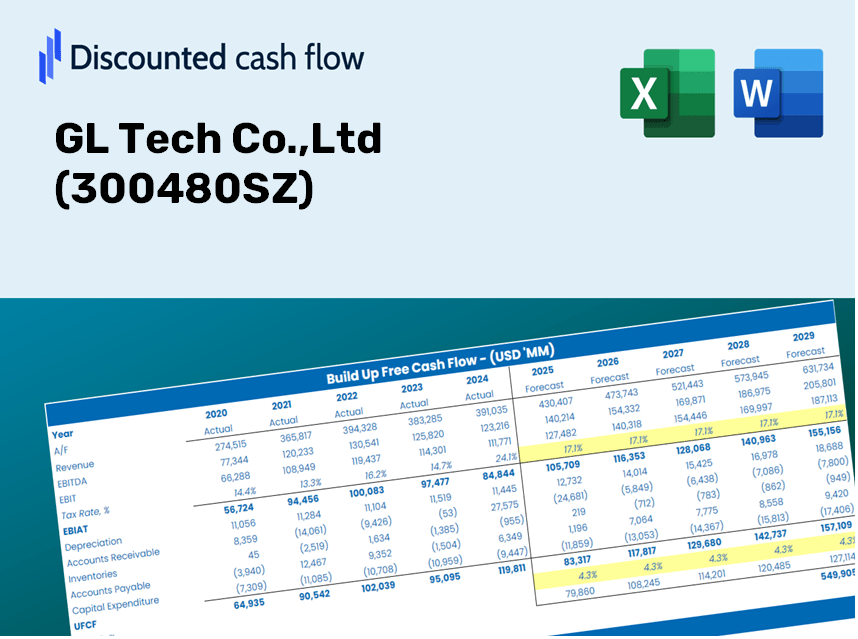
Assuma o controle da análise de avaliação da GL Tech Co., Ltd (300480SZ) com nossa calculadora DCF de ponta! Pré -carregado com dados reais (300480SZ), este modelo do Excel o capacita a ajustar as previsões e suposições para calcular com precisão o valor intrínseco da GL Tech Co., Ltd.
Discounted Cash Flow (DCF) - (USD MM)
| Year | AY1 2020 |
AY2 2021 |
AY3 2022 |
AY4 2023 |
AY5 2024 |
FY1 2025 |
FY2 2026 |
FY3 2027 |
FY4 2028 |
FY5 2029 |
|---|---|---|---|---|---|---|---|---|---|---|
| Revenue | 311.3 | 530.2 | 614.5 | 660.8 | 573.3 | 688.7 | 827.3 | 993.8 | 1,193.9 | 1,434.2 |
| Revenue Growth, % | 0 | 70.33 | 15.89 | 7.54 | -13.25 | 20.13 | 20.13 | 20.13 | 20.13 | 20.13 |
| EBITDA | 86.9 | 153.8 | 114.9 | 115.6 | -38.6 | 119.0 | 142.9 | 171.7 | 206.3 | 247.8 |
| EBITDA, % | 27.92 | 29.01 | 18.69 | 17.49 | -6.73 | 17.28 | 17.28 | 17.28 | 17.28 | 17.28 |
| Depreciation | 12.4 | 17.7 | 24.7 | 28.3 | 32.3 | 29.3 | 35.2 | 42.3 | 50.8 | 61.0 |
| Depreciation, % | 4 | 3.33 | 4.02 | 4.28 | 5.63 | 4.25 | 4.25 | 4.25 | 4.25 | 4.25 |
| EBIT | 74.5 | 136.2 | 90.2 | 87.3 | -70.9 | 89.7 | 107.8 | 129.4 | 155.5 | 186.8 |
| EBIT, % | 23.92 | 25.68 | 14.67 | 13.21 | -12.36 | 13.02 | 13.02 | 13.02 | 13.02 | 13.02 |
| Total Cash | 179.7 | 470.9 | 485.1 | 707.0 | 543.1 | 578.8 | 695.3 | 835.2 | 1,003.3 | 1,205.3 |
| Total Cash, percent | .0 | .0 | .0 | .0 | .0 | .0 | .0 | .0 | .0 | .0 |
| Account Receivables | 305.9 | 400.5 | 461.4 | 426.4 | 433.4 | 535.8 | 643.7 | 773.2 | 928.8 | 1,115.8 |
| Account Receivables, % | 98.26 | 75.53 | 75.09 | 64.52 | 75.6 | 77.8 | 77.8 | 77.8 | 77.8 | 77.8 |
| Inventories | 72.9 | 182.0 | 252.5 | 285.4 | 338.4 | 276.9 | 332.7 | 399.6 | 480.1 | 576.7 |
| Inventories, % | 23.41 | 34.33 | 41.1 | 43.19 | 59.03 | 40.21 | 40.21 | 40.21 | 40.21 | 40.21 |
| Accounts Payable | 30.6 | 92.8 | 65.9 | 74.3 | 77.9 | 86.6 | 104.1 | 125.0 | 150.2 | 180.4 |
| Accounts Payable, % | 9.83 | 17.5 | 10.73 | 11.24 | 13.59 | 12.58 | 12.58 | 12.58 | 12.58 | 12.58 |
| Capital Expenditure | -39.4 | -16.3 | -97.2 | -99.9 | -118.6 | -92.8 | -111.4 | -133.9 | -160.8 | -193.2 |
| Capital Expenditure, % | -12.66 | -3.07 | -15.81 | -15.12 | -20.69 | -13.47 | -13.47 | -13.47 | -13.47 | -13.47 |
| Tax Rate, % | -28.05 | -28.05 | -28.05 | -28.05 | -28.05 | -28.05 | -28.05 | -28.05 | -28.05 | -28.05 |
| EBITAT | 60.4 | 126.1 | 72.9 | 74.1 | -90.8 | 78.8 | 94.7 | 113.8 | 136.7 | 164.2 |
| Depreciation | ||||||||||
| Changes in Account Receivables | ||||||||||
| Changes in Inventories | ||||||||||
| Changes in Accounts Payable | ||||||||||
| Capital Expenditure | ||||||||||
| UFCF | -314.7 | -14.0 | -157.8 | 13.1 | -233.6 | -16.8 | -127.7 | -153.4 | -184.3 | -221.4 |
| WACC, % | 4.6 | 4.63 | 4.6 | 4.61 | 4.65 | 4.62 | 4.62 | 4.62 | 4.62 | 4.62 |
| PV UFCF | ||||||||||
| SUM PV UFCF | -597.1 | |||||||||
| Long Term Growth Rate, % | 4.00 | |||||||||
| Free cash flow (T + 1) | -230 | |||||||||
| Terminal Value | -37,176 | |||||||||
| Present Terminal Value | -29,662 | |||||||||
| Enterprise Value | -30,259 | |||||||||
| Net Debt | -115 | |||||||||
| Equity Value | -30,144 | |||||||||
| Diluted Shares Outstanding, MM | 404 | |||||||||
| Equity Value Per Share | -74.64 |
Benefits of Choosing GL Tech Co., Ltd
- Comprehensive Financial Model: Leveraging actual performance data for accurate DCF valuations of GL Tech (300480SZ).
- Complete Forecast Flexibility: Modify revenue growth, profit margins, WACC, and other critical metrics to fit your analysis.
- Real-Time Calculations: Automatic updates allow you to view results instantly as you make adjustments.
- Professional-Grade Template: A polished Excel file designed specifically for conducting high-quality valuations.
- Adaptable and Reusable: Customizable for ongoing use, enabling detailed forecasts across various scenarios.
Key Features
- Comprehensive DCF Calculator: Features detailed unlevered and levered DCF valuation models tailored for GL Tech Co.,Ltd (300480SZ).
- WACC Calculator: Equipped with a customizable Weighted Average Cost of Capital sheet for precise input adjustments.
- Adjustable Forecast Assumptions: Easily modify growth rates, capital expenditures, and discount rates to fit your analysis.
- Integrated Financial Ratios: Evaluate profitability, leverage, and efficiency ratios specific to GL Tech Co.,Ltd (300480SZ).
- Interactive Dashboard and Charts: Visual representations summarize key valuation metrics for streamlined analysis.
How It Functions
- Download: Obtain the pre-built Excel file containing financial data for GL Tech Co., Ltd (300480SZ).
- Customize: Tailor forecasts by modifying key metrics such as revenue growth, EBITDA %, and WACC.
- Update Automatically: Enjoy real-time updates for intrinsic value and NPV calculations.
- Test Scenarios: Generate various projections and compare results instantly.
- Make Decisions: Leverage the valuation insights to inform your investment strategy.
Why Choose This Calculator for GL Tech Co., Ltd (300480SZ)?
- All-in-One Solution: Combines DCF, WACC, and financial ratio analyses into a single, effective tool.
- Flexible Input Options: Modify yellow-highlighted fields to explore different financial scenarios.
- In-Depth Analysis: Automatically computes GL Tech’s intrinsic value and Net Present Value.
- Preloaded Information: Access to historical and projected data for reliable baseline assessments.
- High Professional Standards: Perfect for financial analysts, investors, and business consultants.
Who Can Benefit from GL Tech Co., Ltd. (300480SZ)?
- Investors: Gain confidence in your investment choices with a sophisticated evaluation tool.
- Financial Analysts: Streamline your workflow using a customizable DCF model that’s ready to go.
- Consultants: Effortlessly modify the template for client meetings or detailed reports.
- Finance Enthusiasts: Enhance your knowledge of valuation methods through practical, real-world examples.
- Educators and Students: Utilize this resource as an effective learning aid in finance studies.
Contents of the Template
- Pre-Filled Data: Features GL Tech Co.,Ltd's historical financials and projections.
- Discounted Cash Flow Model: An editable DCF valuation model equipped with automatic calculations.
- Weighted Average Cost of Capital (WACC): A specialized sheet for calculating WACC based on custom parameters.
- Key Financial Ratios: Evaluate GL Tech Co.,Ltd's profitability, efficiency, and leverage metrics.
- Customizable Inputs: Easily modify revenue growth, margins, and tax rates.
- Clear Dashboard: Graphs and tables that summarize essential valuation results.
Disclaimer
All information, articles, and product details provided on this website are for general informational and educational purposes only. We do not claim any ownership over, nor do we intend to infringe upon, any trademarks, copyrights, logos, brand names, or other intellectual property mentioned or depicted on this site. Such intellectual property remains the property of its respective owners, and any references here are made solely for identification or informational purposes, without implying any affiliation, endorsement, or partnership.
We make no representations or warranties, express or implied, regarding the accuracy, completeness, or suitability of any content or products presented. Nothing on this website should be construed as legal, tax, investment, financial, medical, or other professional advice. In addition, no part of this site—including articles or product references—constitutes a solicitation, recommendation, endorsement, advertisement, or offer to buy or sell any securities, franchises, or other financial instruments, particularly in jurisdictions where such activity would be unlawful.
All content is of a general nature and may not address the specific circumstances of any individual or entity. It is not a substitute for professional advice or services. Any actions you take based on the information provided here are strictly at your own risk. You accept full responsibility for any decisions or outcomes arising from your use of this website and agree to release us from any liability in connection with your use of, or reliance upon, the content or products found herein.