
|
Betta Pharmaceuticals Co., Ltd. (300558.sz) Avaliação DCF |
Totalmente Editável: Adapte-Se Às Suas Necessidades No Excel Ou Planilhas
Design Profissional: Modelos Confiáveis E Padrão Da Indústria
Pré-Construídos Para Uso Rápido E Eficiente
Compatível com MAC/PC, totalmente desbloqueado
Não É Necessária Experiência; Fácil De Seguir
Betta Pharmaceuticals Co., Ltd. (300558.SZ) Bundle
Como investidor ou analista, esta calculadora DCF (300558SZ) é o seu recurso preferido para uma avaliação precisa. Apresentando dados reais da Betta Pharmaceuticals Co., Ltd., você pode ajustar as previsões e observar instantaneamente os efeitos.
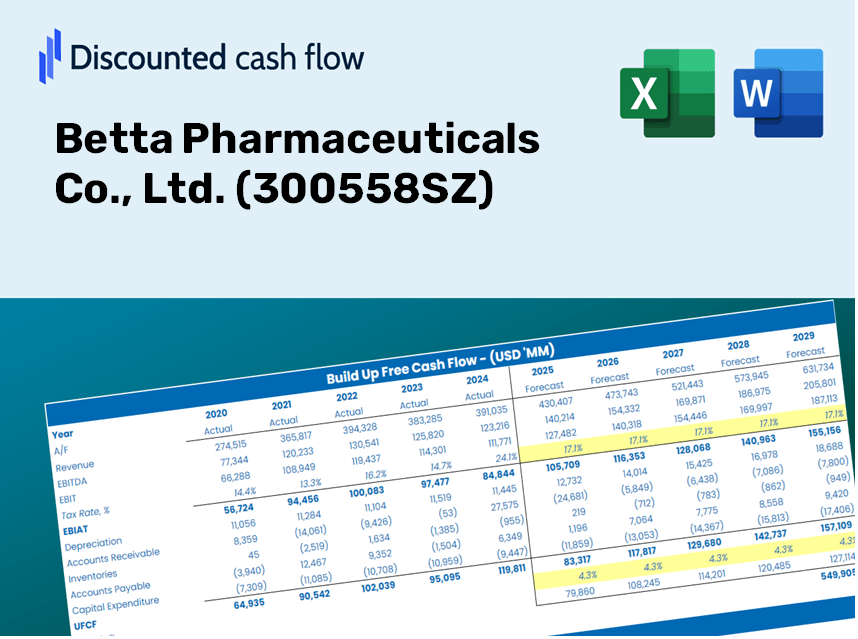
Discounted Cash Flow (DCF) - (USD MM)
| Year | AY1 2020 |
AY2 2021 |
AY3 2022 |
AY4 2023 |
AY5 2024 |
FY1 2025 |
FY2 2026 |
FY3 2027 |
FY4 2028 |
FY5 2029 |
|---|---|---|---|---|---|---|---|---|---|---|
| Revenue | 1,870.3 | 2,245.9 | 2,376.6 | 2,456.2 | 2,892.0 | 3,231.7 | 3,611.4 | 4,035.7 | 4,509.8 | 5,039.6 |
| Revenue Growth, % | 0 | 20.08 | 5.82 | 3.35 | 17.74 | 11.75 | 11.75 | 11.75 | 11.75 | 11.75 |
| EBITDA | 862.9 | 580.9 | 455.5 | 696.1 | 811.6 | 953.8 | 1,065.9 | 1,191.1 | 1,331.0 | 1,487.4 |
| EBITDA, % | 46.14 | 25.86 | 19.17 | 28.34 | 28.06 | 29.51 | 29.51 | 29.51 | 29.51 | 29.51 |
| Depreciation | 155.9 | 174.5 | 253.7 | 303.5 | 372.0 | 336.1 | 375.5 | 419.7 | 469.0 | 524.1 |
| Depreciation, % | 8.33 | 7.77 | 10.67 | 12.36 | 12.86 | 10.4 | 10.4 | 10.4 | 10.4 | 10.4 |
| EBIT | 707.0 | 406.4 | 201.8 | 392.6 | 439.6 | 617.7 | 690.3 | 771.4 | 862.1 | 963.3 |
| EBIT, % | 37.8 | 18.1 | 8.49 | 15.98 | 15.2 | 19.12 | 19.12 | 19.12 | 19.12 | 19.12 |
| Total Cash | 1,345.9 | 993.0 | 731.3 | 752.5 | 598.1 | 1,281.5 | 1,432.1 | 1,600.3 | 1,788.3 | 1,998.4 |
| Total Cash, percent | .0 | .0 | .0 | .0 | .0 | .0 | .0 | .0 | .0 | .0 |
| Account Receivables | 59.4 | 173.4 | 523.0 | 286.4 | 100.3 | 310.5 | 346.9 | 387.7 | 433.2 | 484.1 |
| Account Receivables, % | 3.18 | 7.72 | 22.01 | 11.66 | 3.47 | 9.61 | 9.61 | 9.61 | 9.61 | 9.61 |
| Inventories | 188.6 | 293.3 | 372.2 | 327.5 | 290.1 | 401.8 | 449.0 | 501.8 | 560.7 | 626.6 |
| Inventories, % | 10.08 | 13.06 | 15.66 | 13.33 | 10.03 | 12.43 | 12.43 | 12.43 | 12.43 | 12.43 |
| Accounts Payable | 113.6 | 431.2 | 591.0 | 800.1 | 746.1 | 701.4 | 783.8 | 875.9 | 978.8 | 1,093.8 |
| Accounts Payable, % | 6.08 | 19.2 | 24.87 | 32.58 | 25.8 | 21.7 | 21.7 | 21.7 | 21.7 | 21.7 |
| Capital Expenditure | -685.8 | -758.4 | -1,010.5 | -1,096.0 | -827.6 | -1,203.5 | -1,344.9 | -1,502.9 | -1,679.4 | -1,876.7 |
| Capital Expenditure, % | -36.67 | -33.77 | -42.52 | -44.62 | -28.62 | -37.24 | -37.24 | -37.24 | -37.24 | -37.24 |
| Tax Rate, % | -2.13 | -2.13 | -2.13 | -2.13 | -2.13 | -2.13 | -2.13 | -2.13 | -2.13 | -2.13 |
| EBITAT | 643.0 | 399.3 | 335.1 | 424.2 | 449.0 | 604.4 | 675.4 | 754.8 | 843.4 | 942.5 |
| Depreciation | ||||||||||
| Changes in Account Receivables | ||||||||||
| Changes in Inventories | ||||||||||
| Changes in Accounts Payable | ||||||||||
| Capital Expenditure | ||||||||||
| UFCF | -21.3 | -85.8 | -690.4 | 122.1 | 162.9 | -629.6 | -295.2 | -329.9 | -368.6 | -411.9 |
| WACC, % | 6.05 | 6.06 | 6.06 | 6.06 | 6.06 | 6.06 | 6.06 | 6.06 | 6.06 | 6.06 |
| PV UFCF | ||||||||||
| SUM PV UFCF | -1,730.9 | |||||||||
| Long Term Growth Rate, % | 2.00 | |||||||||
| Free cash flow (T + 1) | -420 | |||||||||
| Terminal Value | -10,350 | |||||||||
| Present Terminal Value | -7,712 | |||||||||
| Enterprise Value | -9,443 | |||||||||
| Net Debt | 1,182 | |||||||||
| Equity Value | -10,625 | |||||||||
| Diluted Shares Outstanding, MM | 419 | |||||||||
| Equity Value Per Share | -25.34 |
What You Will Receive
- Accurate 300558SZ Financial Data: Contains both historical and projected data for precise valuation.
- Customizable Parameters: Adjust WACC, tax rates, revenue growth, and capital investments as needed.
- Automated Calculations: Intrinsic value and NPV are computed in real-time.
- Scenario Modeling: Explore various scenarios to assess the future performance of Betta Pharmaceuticals.
- User-Friendly Interface: Designed for professionals while remaining accessible to newcomers.
Key Features
- Comprehensive DCF Calculator: Features detailed unlevered and levered DCF valuation models tailored for Betta Pharmaceuticals Co., Ltd. (300558SZ).
- WACC Calculator: Comes with a pre-designed Weighted Average Cost of Capital sheet that allows for customizable inputs.
- Adjustable Forecast Assumptions: Easily modify growth projections, capital expenditures, and discount rates.
- Integrated Financial Ratios: Assess profitability, leverage, and efficiency ratios specific to Betta Pharmaceuticals Co., Ltd. (300558SZ).
- Interactive Dashboard and Charts: Visual outputs that summarize essential valuation metrics for straightforward analysis.
How It Operates
- Download the Template: Gain immediate access to the Excel-based Betta Pharmaceuticals DCF Calculator.
- Input Your Assumptions: Modify the yellow-highlighted cells for growth rates, WACC, profit margins, and other variables.
- Instant Calculations: The model will automatically recalculate the intrinsic value of Betta Pharmaceuticals (300558SZ).
- Test Scenarios: Simulate various assumptions to assess potential changes in valuation.
- Analyze and Decide: Utilize the results to inform your investment decisions or financial evaluations.
Why Opt for Betta Pharmaceuticals Co., Ltd. (300558SZ) Calculator?
- All-in-One Solution: Features DCF, WACC, and various financial ratio analyses seamlessly integrated.
- Adjustable Parameters: Modify the yellow-highlighted cells to explore different financial scenarios.
- In-Depth Analysis: Automatically computes the intrinsic value and Net Present Value for Betta Pharmaceuticals.
- Preloaded Information: Access to historical and projected data gives you a reliable foundation for analysis.
- High-Quality Standards: Perfect for financial analysts, investors, and business advisors focused on Betta Pharmaceuticals.
Who Should Utilize Betta Pharmaceuticals Co., Ltd.?
- Individual Investors: Gain the insights needed to make informed decisions about investing in Betta Pharmaceuticals (300558SZ).
- Financial Analysts: Enhance your analysis with efficient valuation models specifically designed for Betta Pharmaceuticals (300558SZ).
- Consultants: Provide swift and accurate valuation assessments to clients regarding Betta Pharmaceuticals (300558SZ).
- Business Owners: Learn how the valuation of a major player like Betta Pharmaceuticals (300558SZ) can inform your own business strategies.
- Finance Students: Develop your understanding of valuation methods through real-world applications involving Betta Pharmaceuticals (300558SZ).
Contents of the Template
- Pre-Filled DCF Model: Betta Pharmaceuticals' financial data preloaded for immediate application.
- WACC Calculator: Comprehensive calculations for Weighted Average Cost of Capital.
- Financial Ratios: Assess Betta Pharmaceuticals' profitability, leverage, and operational efficiency.
- Editable Inputs: Modify assumptions like growth rates, margins, and CAPEX to align with your analyses.
- Financial Statements: Annual and quarterly reports available for in-depth examination.
- Interactive Dashboard: Effortlessly visualize essential valuation metrics and outcomes.
Disclaimer
All information, articles, and product details provided on this website are for general informational and educational purposes only. We do not claim any ownership over, nor do we intend to infringe upon, any trademarks, copyrights, logos, brand names, or other intellectual property mentioned or depicted on this site. Such intellectual property remains the property of its respective owners, and any references here are made solely for identification or informational purposes, without implying any affiliation, endorsement, or partnership.
We make no representations or warranties, express or implied, regarding the accuracy, completeness, or suitability of any content or products presented. Nothing on this website should be construed as legal, tax, investment, financial, medical, or other professional advice. In addition, no part of this site—including articles or product references—constitutes a solicitation, recommendation, endorsement, advertisement, or offer to buy or sell any securities, franchises, or other financial instruments, particularly in jurisdictions where such activity would be unlawful.
All content is of a general nature and may not address the specific circumstances of any individual or entity. It is not a substitute for professional advice or services. Any actions you take based on the information provided here are strictly at your own risk. You accept full responsibility for any decisions or outcomes arising from your use of this website and agree to release us from any liability in connection with your use of, or reliance upon, the content or products found herein.