
|
Wuxi Best Precision Machinery Co., Ltd. (300580.sz) Avaliação DCF |
Totalmente Editável: Adapte-Se Às Suas Necessidades No Excel Ou Planilhas
Design Profissional: Modelos Confiáveis E Padrão Da Indústria
Pré-Construídos Para Uso Rápido E Eficiente
Compatível com MAC/PC, totalmente desbloqueado
Não É Necessária Experiência; Fácil De Seguir
Wuxi Best Precision Machinery Co., Ltd. (300580.SZ) Bundle
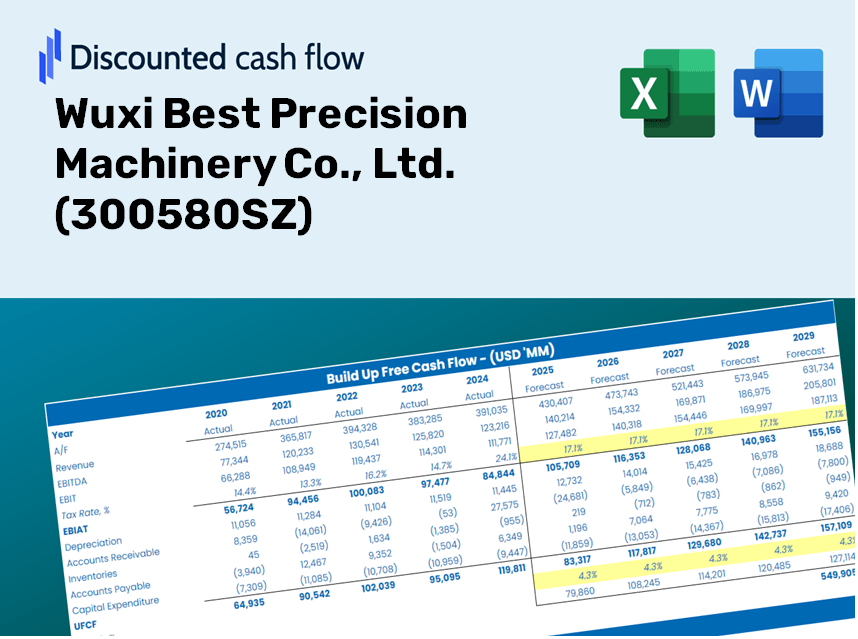
Obtenha informações sobre sua análise de avaliação Wuxi Best Precision Machinery Co., Ltd. (300580SZ) usando nossa sofisticada calculadora DCF! Pré -carregado com dados reais (300580SZ), este modelo do Excel permite ajustar as previsões e suposições para determinar com precisão o valor intrínseco de Wuxi Best Precision Machinery Co., Ltd.
Discounted Cash Flow (DCF) - (USD MM)
| Year | AY1 2020 |
AY2 2021 |
AY3 2022 |
AY4 2023 |
AY5 2024 |
FY1 2025 |
FY2 2026 |
FY3 2027 |
FY4 2028 |
FY5 2029 |
|---|---|---|---|---|---|---|---|---|---|---|
| Revenue | 931.1 | 1,057.1 | 1,097.3 | 1,343.2 | 1,357.0 | 1,495.4 | 1,647.8 | 1,815.7 | 2,000.8 | 2,204.8 |
| Revenue Growth, % | 0 | 13.53 | 3.8 | 22.42 | 1.03 | 10.19 | 10.19 | 10.19 | 10.19 | 10.19 |
| EBITDA | 288.6 | 308.0 | 315.4 | 443.9 | 460.0 | 466.0 | 513.5 | 565.8 | 623.5 | 687.1 |
| EBITDA, % | 31 | 29.13 | 28.74 | 33.04 | 33.9 | 31.16 | 31.16 | 31.16 | 31.16 | 31.16 |
| Depreciation | 100.4 | 116.1 | 135.0 | 164.4 | 173.6 | 176.8 | 194.8 | 214.6 | 236.5 | 260.6 |
| Depreciation, % | 10.78 | 10.99 | 12.3 | 12.24 | 12.79 | 11.82 | 11.82 | 11.82 | 11.82 | 11.82 |
| EBIT | 188.2 | 191.8 | 180.4 | 279.4 | 286.5 | 289.2 | 318.7 | 351.2 | 387.0 | 426.5 |
| EBIT, % | 20.21 | 18.15 | 16.44 | 20.8 | 21.11 | 19.34 | 19.34 | 19.34 | 19.34 | 19.34 |
| Total Cash | 797.7 | 815.7 | 784.6 | 919.1 | 941.4 | 1,112.9 | 1,226.4 | 1,351.4 | 1,489.1 | 1,640.9 |
| Total Cash, percent | .0 | .0 | .0 | .0 | .0 | .0 | .0 | .0 | .0 | .0 |
| Account Receivables | 536.2 | 576.1 | 605.4 | 649.9 | 603.8 | 778.0 | 857.3 | 944.7 | 1,041.0 | 1,147.1 |
| Account Receivables, % | 57.59 | 54.5 | 55.18 | 48.38 | 44.49 | 52.03 | 52.03 | 52.03 | 52.03 | 52.03 |
| Inventories | 156.5 | 224.5 | 312.5 | 290.3 | 270.6 | 323.2 | 356.1 | 392.4 | 432.4 | 476.5 |
| Inventories, % | 16.8 | 21.23 | 28.48 | 21.61 | 19.94 | 21.61 | 21.61 | 21.61 | 21.61 | 21.61 |
| Accounts Payable | 244.4 | 338.6 | 420.8 | 357.9 | 293.7 | 433.4 | 477.6 | 526.3 | 579.9 | 639.0 |
| Accounts Payable, % | 26.25 | 32.03 | 38.35 | 26.64 | 21.65 | 28.98 | 28.98 | 28.98 | 28.98 | 28.98 |
| Capital Expenditure | -137.1 | -224.7 | -332.7 | -239.4 | -93.4 | -272.2 | -299.9 | -330.5 | -364.2 | -401.3 |
| Capital Expenditure, % | -14.72 | -21.25 | -30.32 | -17.82 | -6.88 | -18.2 | -18.2 | -18.2 | -18.2 | -18.2 |
| Tax Rate, % | 11.72 | 11.72 | 11.72 | 11.72 | 11.72 | 11.72 | 11.72 | 11.72 | 11.72 | 11.72 |
| EBITAT | 164.2 | 167.1 | 200.3 | 246.3 | 252.9 | 260.8 | 287.3 | 316.6 | 348.9 | 384.5 |
| Depreciation | ||||||||||
| Changes in Account Receivables | ||||||||||
| Changes in Inventories | ||||||||||
| Changes in Accounts Payable | ||||||||||
| Capital Expenditure | ||||||||||
| UFCF | -320.8 | 44.9 | -32.6 | 86.2 | 334.7 | 78.2 | 114.1 | 125.8 | 138.6 | 152.7 |
| WACC, % | 5.54 | 5.54 | 5.54 | 5.54 | 5.54 | 5.54 | 5.54 | 5.54 | 5.54 | 5.54 |
| PV UFCF | ||||||||||
| SUM PV UFCF | 511.8 | |||||||||
| Long Term Growth Rate, % | 3.50 | |||||||||
| Free cash flow (T + 1) | 158 | |||||||||
| Terminal Value | 7,738 | |||||||||
| Present Terminal Value | 5,909 | |||||||||
| Enterprise Value | 6,420 | |||||||||
| Net Debt | -186 | |||||||||
| Equity Value | 6,607 | |||||||||
| Diluted Shares Outstanding, MM | 499 | |||||||||
| Equity Value Per Share | 13.24 |
What You Will Receive
- Customizable Forecast Inputs: Effortlessly adjust parameters (growth %, margins, WACC) to explore various scenarios.
- Comprehensive Financial Data: Wuxi Best Precision Machinery Co., Ltd.'s (300580SZ) financials pre-loaded to enhance your analysis.
- Automatic DCF Outputs: The template automatically computes Net Present Value (NPV) and intrinsic value for your convenience.
- Professional and Adaptable: A sophisticated Excel model designed to meet your valuation requirements.
- Designed for Analysts and Investors: Perfect for evaluating projections, confirming strategies, and optimizing time efficiency.
Key Features
- Customizable Forecast Inputs: Adjust essential factors such as sales growth, operating margins, and investment expenditures.
- Instant DCF Valuation: Quickly computes intrinsic value, net present value, and various financial outputs.
- High-Precision Accuracy: Leverages Wuxi Best Precision Machinery’s actual financial data for dependable valuation results.
- Simplified Scenario Analysis: Easily evaluate different assumptions and analyze varied results.
- Efficiency Booster: Remove the hassle of constructing intricate valuation models from the ground up.
How It Works
- Step 1: Download the Excel file.
- Step 2: Review the pre-loaded data on Wuxi Best Precision Machinery (300580SZ), including historical and projected figures.
- Step 3: Modify key assumptions (indicated in yellow cells) based on your analysis.
- Step 4: Observe automatic recalculations for the intrinsic value of Wuxi Best Precision Machinery (300580SZ).
- Step 5: Utilize the results for your investment strategies or reporting needs.
Why Opt for Wuxi Best Precision Machinery's Calculator?
- Engineered for Experts: A sophisticated tool tailored for engineers, production managers, and industry consultants.
- Accurate Data: Historical and projected financial information for Wuxi Best Precision Machinery ([300580SZ]) preloaded for precision.
- Scenario Analysis: Effortlessly simulate various forecasts and assumptions.
- Clear Results: Instantly generates intrinsic value, NPV, and essential metrics.
- User-Friendly: Comprehensive step-by-step instructions make the process straightforward.
Who Can Benefit from This Product?
- Investors: Gain precise insights into Wuxi Best Precision Machinery's fair value before investing decisions.
- CFOs: Utilize a high-quality DCF model for accurate financial analysis and reporting.
- Consultants: Efficiently customize the template for client valuation reports.
- Entrepreneurs: Learn about financial modeling techniques employed by leading companies.
- Educators: Employ it as a resource to teach various valuation methods.
Contents of the Template
- Comprehensive DCF Model: An editable template featuring detailed valuation calculations.
- Real-World Data: Wuxi Best Precision Machinery Co., Ltd.'s (300580SZ) historical and projected financials preloaded for analysis.
- Customizable Parameters: Modify WACC, growth rates, and tax assumptions to explore various scenarios.
- Financial Statements: Complete annual and quarterly breakdowns for in-depth insights.
- Key Ratios: Integrated analysis focusing on profitability, efficiency, and leverage metrics.
- Dashboard with Visual Outputs: Visualizations such as charts and tables for clear, actionable results.
Disclaimer
All information, articles, and product details provided on this website are for general informational and educational purposes only. We do not claim any ownership over, nor do we intend to infringe upon, any trademarks, copyrights, logos, brand names, or other intellectual property mentioned or depicted on this site. Such intellectual property remains the property of its respective owners, and any references here are made solely for identification or informational purposes, without implying any affiliation, endorsement, or partnership.
We make no representations or warranties, express or implied, regarding the accuracy, completeness, or suitability of any content or products presented. Nothing on this website should be construed as legal, tax, investment, financial, medical, or other professional advice. In addition, no part of this site—including articles or product references—constitutes a solicitation, recommendation, endorsement, advertisement, or offer to buy or sell any securities, franchises, or other financial instruments, particularly in jurisdictions where such activity would be unlawful.
All content is of a general nature and may not address the specific circumstances of any individual or entity. It is not a substitute for professional advice or services. Any actions you take based on the information provided here are strictly at your own risk. You accept full responsibility for any decisions or outcomes arising from your use of this website and agree to release us from any liability in connection with your use of, or reliance upon, the content or products found herein.