
|
Shenzhen Frd Science & Technology Co., Ltd. (300602.SZ) Avaliação DCF |
Totalmente Editável: Adapte-Se Às Suas Necessidades No Excel Ou Planilhas
Design Profissional: Modelos Confiáveis E Padrão Da Indústria
Pré-Construídos Para Uso Rápido E Eficiente
Compatível com MAC/PC, totalmente desbloqueado
Não É Necessária Experiência; Fácil De Seguir
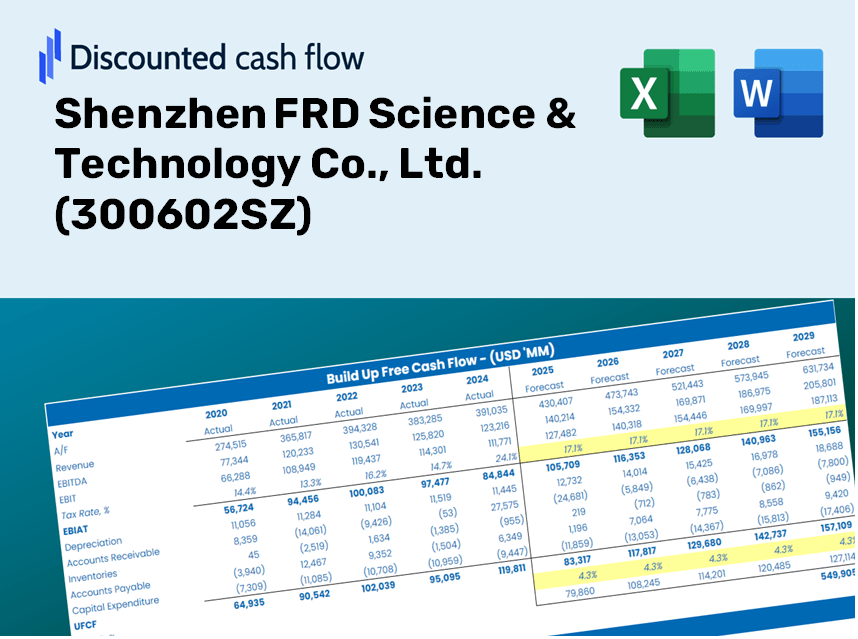
Shenzhen FRD Science & Technology Co., Ltd. (300602.SZ) Bundle
Obtenha uma visão de sua ciência Shenzhen FRD & Análise de avaliação da Technology Co., Ltd. (300602SZ) usando nossa calculadora DCF de ponta! Este modelo do Excel é pré -carregado com dados reais (300602SZ), permitindo que você ajuste as previsões e suposições para determinar com precisão o valor intrínseco de Shenzhen Frd Science & Technology Co., Ltd.
Discounted Cash Flow (DCF) - (USD MM)
| Year | AY1 2020 |
AY2 2021 |
AY3 2022 |
AY4 2023 |
AY5 2024 |
FY1 2025 |
FY2 2026 |
FY3 2027 |
FY4 2028 |
FY5 2029 |
|---|---|---|---|---|---|---|---|---|---|---|
| Revenue | 2,929.3 | 3,058.0 | 4,124.5 | 4,345.9 | 5,030.8 | 5,790.4 | 6,664.6 | 7,670.9 | 8,829.1 | 10,162.2 |
| Revenue Growth, % | 0 | 4.39 | 34.88 | 5.37 | 15.76 | 15.1 | 15.1 | 15.1 | 15.1 | 15.1 |
| EBITDA | 297.6 | 18.7 | 122.9 | 303.4 | 392.5 | 330.4 | 380.3 | 437.8 | 503.9 | 579.9 |
| EBITDA, % | 10.16 | 0.6126 | 2.98 | 6.98 | 7.8 | 5.71 | 5.71 | 5.71 | 5.71 | 5.71 |
| Depreciation | 104.4 | 131.6 | 162.0 | 177.8 | 184.2 | 226.4 | 260.6 | 299.9 | 345.2 | 397.3 |
| Depreciation, % | 3.57 | 4.3 | 3.93 | 4.09 | 3.66 | 3.91 | 3.91 | 3.91 | 3.91 | 3.91 |
| EBIT | 193.2 | -112.9 | -39.1 | 125.6 | 208.4 | 104.1 | 119.8 | 137.9 | 158.7 | 182.6 |
| EBIT, % | 6.59 | -3.69 | -0.94755 | 2.89 | 4.14 | 1.8 | 1.8 | 1.8 | 1.8 | 1.8 |
| Total Cash | 1,011.7 | 691.6 | 594.6 | 1,254.0 | 1,181.4 | 1,434.9 | 1,651.6 | 1,901.0 | 2,188.0 | 2,518.3 |
| Total Cash, percent | .0 | .0 | .0 | .0 | .0 | .0 | .0 | .0 | .0 | .0 |
| Account Receivables | 1,032.5 | 1,373.7 | 1,767.9 | 2,056.5 | 2,508.3 | 2,550.2 | 2,935.2 | 3,378.4 | 3,888.5 | 4,475.6 |
| Account Receivables, % | 35.25 | 44.92 | 42.86 | 47.32 | 49.86 | 44.04 | 44.04 | 44.04 | 44.04 | 44.04 |
| Inventories | 544.8 | 811.1 | 836.5 | 808.6 | 938.5 | 1,188.9 | 1,368.5 | 1,575.1 | 1,812.9 | 2,086.6 |
| Inventories, % | 18.6 | 26.53 | 20.28 | 18.61 | 18.66 | 20.53 | 20.53 | 20.53 | 20.53 | 20.53 |
| Accounts Payable | 991.5 | 1,343.4 | 1,295.7 | 1,618.7 | 1,956.1 | 2,146.2 | 2,470.2 | 2,843.2 | 3,272.4 | 3,766.5 |
| Accounts Payable, % | 33.85 | 43.93 | 31.42 | 37.25 | 38.88 | 37.06 | 37.06 | 37.06 | 37.06 | 37.06 |
| Capital Expenditure | -550.5 | -619.3 | -638.1 | -478.9 | -368.5 | -843.8 | -971.2 | -1,117.8 | -1,286.6 | -1,480.8 |
| Capital Expenditure, % | -18.79 | -20.25 | -15.47 | -11.02 | -7.32 | -14.57 | -14.57 | -14.57 | -14.57 | -14.57 |
| Tax Rate, % | 10.36 | 10.36 | 10.36 | 10.36 | 10.36 | 10.36 | 10.36 | 10.36 | 10.36 | 10.36 |
| EBITAT | 179.6 | 142.3 | -91.6 | 143.3 | 186.8 | 79.6 | 91.7 | 105.5 | 121.4 | 139.7 |
| Depreciation | ||||||||||
| Changes in Account Receivables | ||||||||||
| Changes in Inventories | ||||||||||
| Changes in Accounts Payable | ||||||||||
| Capital Expenditure | ||||||||||
| UFCF | -852.4 | -600.9 | -1,034.9 | -95.6 | -241.9 | -640.0 | -859.5 | -989.2 | -1,138.6 | -1,310.5 |
| WACC, % | 4.46 | 4.27 | 4.48 | 4.48 | 4.46 | 4.43 | 4.43 | 4.43 | 4.43 | 4.43 |
| PV UFCF | ||||||||||
| SUM PV UFCF | -4,282.1 | |||||||||
| Long Term Growth Rate, % | 4.00 | |||||||||
| Free cash flow (T + 1) | -1,363 | |||||||||
| Terminal Value | -317,408 | |||||||||
| Present Terminal Value | -255,567 | |||||||||
| Enterprise Value | -259,849 | |||||||||
| Net Debt | -79 | |||||||||
| Equity Value | -259,770 | |||||||||
| Diluted Shares Outstanding, MM | 572 | |||||||||
| Equity Value Per Share | -453.83 |
Benefits You Will Receive
- Pre-Built Financial Model: Utilize Shenzhen FRD Science & Technology Co., Ltd.'s (300602SZ) actual data for accurate DCF valuation.
- Comprehensive Forecast Control: Modify revenue growth, profit margins, WACC, and other essential drivers as needed.
- Real-Time Calculations: Automatic updates provide instant feedback as you adjust inputs.
- Professional-Grade Template: An enhanced Excel file crafted for high-level valuation purposes.
- Flexible and Reusable: Designed for adaptability, making it suitable for multiple detailed forecasts.
Key Features
- Real-Time FRD Data: Pre-loaded with Shenzhen FRD Science & Technology Co., Ltd.'s historical performance metrics and future projections.
- Comprehensive Customization Options: Tailor inputs for revenue growth, profit margins, discount rates, tax implications, and capital investments.
- Adaptive Valuation Framework: Instantly calculates Net Present Value (NPV) and intrinsic worth based on your specified variables.
- Scenario Analysis: Develop various forecasting scenarios to evaluate diverse valuation results.
- User-Friendly Interface: Intuitive design suitable for both seasoned professionals and newcomers.
How It Functions
- Download the Template: Gain immediate access to the Excel-based Shenzhen FRD Science & Technology DCF Calculator.
- Input Your Assumptions: Modify the yellow-highlighted cells to set your growth rates, WACC, margins, and other variables.
- Instant Calculations: The model automatically recalculates the intrinsic value of Shenzhen FRD Science & Technology Co., Ltd. (300602SZ).
- Test Scenarios: Experiment with various assumptions to assess potential changes in valuation.
- Analyze and Decide: Utilize the outcomes to inform your investment or financial analysis strategies.
Why Select Shenzhen FRD Science & Technology Co., Ltd. ([300602SZ])?
- Time Efficiency: No need to start a financial model from the ground up – it's ready for immediate use.
- Enhanced Precision: Dependable financial data and calculations minimize mistakes in valuation.
- Completely Customizable: Adjust the model to suit your specific assumptions and forecasts.
- Simple to Understand: Intuitive charts and outputs facilitate straightforward analysis of the results.
- Endorsed by Professionals: Crafted for experts who prioritize accuracy and user-friendliness.
Who Can Benefit from This Product?
- Finance Students: Master valuation methodologies and practice with actual financial data.
- Researchers: Integrate advanced financial models into your academic studies or research projects.
- Investors: Validate your investment hypotheses and assess the valuation implications for Shenzhen FRD Science & Technology Co., Ltd. (300602SZ).
- Financial Analysts: Enhance your efficiency with a ready-to-use, customizable DCF model.
- Entrepreneurs: Discover how major publicly traded companies like Shenzhen FRD Science & Technology Co., Ltd. (300602SZ) are evaluated in the market.
Contents of the Template
- Detailed DCF Model: Fully editable template featuring in-depth valuation calculations.
- Actual Financial Data: Historical and projected financials for Shenzhen FRD Science & Technology Co., Ltd. (300602SZ) included for thorough analysis.
- Adjustable Parameters: Modify WACC, growth rates, and tax assumptions to explore different scenarios.
- Comprehensive Financial Statements: Complete annual and quarterly financial breakdowns for enhanced insight.
- Essential Ratios: Integrated analysis of profitability, efficiency, and leverage metrics.
- Interactive Dashboard with Visual Outputs: Graphs and tables designed for clear and actionable insights.
Disclaimer
All information, articles, and product details provided on this website are for general informational and educational purposes only. We do not claim any ownership over, nor do we intend to infringe upon, any trademarks, copyrights, logos, brand names, or other intellectual property mentioned or depicted on this site. Such intellectual property remains the property of its respective owners, and any references here are made solely for identification or informational purposes, without implying any affiliation, endorsement, or partnership.
We make no representations or warranties, express or implied, regarding the accuracy, completeness, or suitability of any content or products presented. Nothing on this website should be construed as legal, tax, investment, financial, medical, or other professional advice. In addition, no part of this site—including articles or product references—constitutes a solicitation, recommendation, endorsement, advertisement, or offer to buy or sell any securities, franchises, or other financial instruments, particularly in jurisdictions where such activity would be unlawful.
All content is of a general nature and may not address the specific circumstances of any individual or entity. It is not a substitute for professional advice or services. Any actions you take based on the information provided here are strictly at your own risk. You accept full responsibility for any decisions or outcomes arising from your use of this website and agree to release us from any liability in connection with your use of, or reliance upon, the content or products found herein.