
|
Zhuhai Enpower Electric Co., Ltd. (300681.sz) Avaliação do DCF |
Totalmente Editável: Adapte-Se Às Suas Necessidades No Excel Ou Planilhas
Design Profissional: Modelos Confiáveis E Padrão Da Indústria
Pré-Construídos Para Uso Rápido E Eficiente
Compatível com MAC/PC, totalmente desbloqueado
Não É Necessária Experiência; Fácil De Seguir
Zhuhai Enpower Electric Co.,Ltd. (300681.SZ) Bundle
Procurando avaliar o valor intrínseco da Zhuhai Enpower Electric Co., Ltd.? Nossa calculadora DCF (300681SZ) integra dados do mundo real com recursos abrangentes de personalização, permitindo refinar suas previsões e aprimorar suas estratégias de investimento.
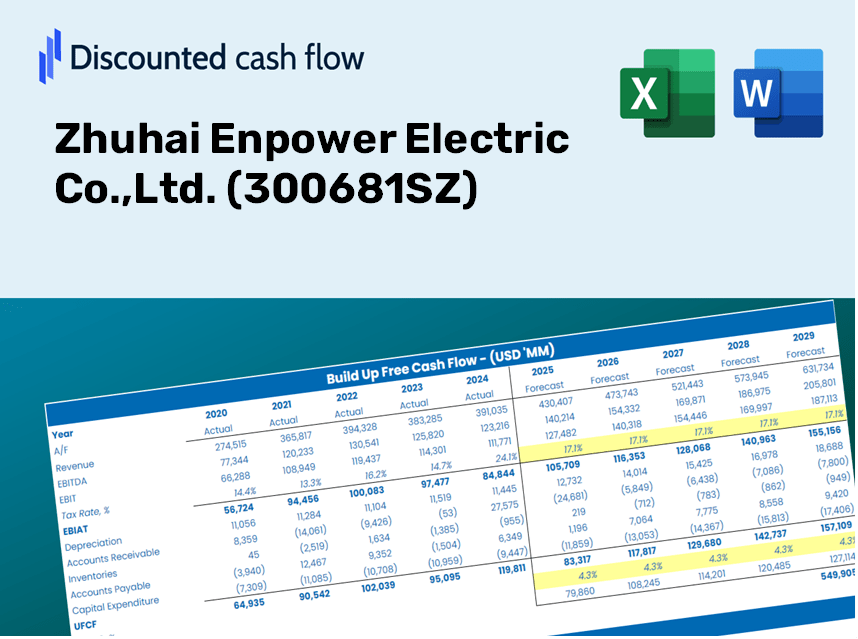
Discounted Cash Flow (DCF) - (USD MM)
| Year | AY1 2020 |
AY2 2021 |
AY3 2022 |
AY4 2023 |
AY5 2024 |
FY1 2025 |
FY2 2026 |
FY3 2027 |
FY4 2028 |
FY5 2029 |
|---|---|---|---|---|---|---|---|---|---|---|
| Revenue | 421.0 | 975.8 | 2,005.7 | 1,963.1 | 2,429.8 | 3,776.1 | 5,868.5 | 9,120.3 | 14,174.0 | 22,028.1 |
| Revenue Growth, % | 0 | 131.8 | 105.55 | -2.12 | 23.77 | 55.41 | 55.41 | 55.41 | 55.41 | 55.41 |
| EBITDA | 16.2 | 45.6 | -10.2 | 86.2 | 101.1 | 125.2 | 194.5 | 302.3 | 469.9 | 730.2 |
| EBITDA, % | 3.86 | 4.67 | -0.51081 | 4.39 | 4.16 | 3.31 | 3.31 | 3.31 | 3.31 | 3.31 |
| Depreciation | 28.5 | 35.7 | 50.6 | 61.5 | 75.8 | 145.0 | 225.3 | 350.1 | 544.1 | 845.6 |
| Depreciation, % | 6.76 | 3.66 | 2.52 | 3.13 | 3.12 | 3.84 | 3.84 | 3.84 | 3.84 | 3.84 |
| EBIT | -12.2 | 9.9 | -60.8 | 24.7 | 25.3 | -19.8 | -30.7 | -47.8 | -74.3 | -115.4 |
| EBIT, % | -2.9 | 1.01 | -3.03 | 1.26 | 1.04 | -0.52387 | -0.52387 | -0.52387 | -0.52387 | -0.52387 |
| Total Cash | 116.0 | 154.5 | 1,096.9 | 580.1 | 903.5 | 1,244.7 | 1,934.4 | 3,006.2 | 4,672.0 | 7,260.8 |
| Total Cash, percent | .0 | .0 | .0 | .0 | .0 | .0 | .0 | .0 | .0 | .0 |
| Account Receivables | 223.9 | 510.5 | 1,067.1 | 1,098.7 | 1,260.6 | 2,013.1 | 3,128.6 | 4,862.2 | 7,556.5 | 11,743.6 |
| Account Receivables, % | 53.2 | 52.32 | 53.2 | 55.97 | 51.88 | 53.31 | 53.31 | 53.31 | 53.31 | 53.31 |
| Inventories | 243.1 | 643.2 | 800.4 | 839.4 | 957.3 | 1,855.8 | 2,884.1 | 4,482.2 | 6,965.9 | 10,825.8 |
| Inventories, % | 57.75 | 65.92 | 39.91 | 42.76 | 39.4 | 49.15 | 49.15 | 49.15 | 49.15 | 49.15 |
| Accounts Payable | 247.0 | 765.7 | 1,255.3 | 762.6 | 1,400.2 | 2,237.0 | 3,476.5 | 5,402.9 | 8,396.8 | 13,049.5 |
| Accounts Payable, % | 58.67 | 78.47 | 62.59 | 38.85 | 57.63 | 59.24 | 59.24 | 59.24 | 59.24 | 59.24 |
| Capital Expenditure | -77.1 | -112.1 | -272.6 | -705.4 | -477.5 | -747.5 | -1,161.7 | -1,805.3 | -2,805.7 | -4,360.4 |
| Capital Expenditure, % | -18.31 | -11.49 | -13.59 | -35.93 | -19.65 | -19.79 | -19.79 | -19.79 | -19.79 | -19.79 |
| Tax Rate, % | -48.53 | -48.53 | -48.53 | -48.53 | -48.53 | -48.53 | -48.53 | -48.53 | -48.53 | -48.53 |
| EBITAT | -16.2 | 12.3 | 284.6 | 26.5 | 37.5 | -15.8 | -24.6 | -38.2 | -59.4 | -92.3 |
| Depreciation | ||||||||||
| Changes in Account Receivables | ||||||||||
| Changes in Inventories | ||||||||||
| Changes in Accounts Payable | ||||||||||
| Capital Expenditure | ||||||||||
| UFCF | -284.9 | -232.0 | -161.5 | -1,180.8 | -6.4 | -1,432.6 | -1,865.2 | -2,898.8 | -4,505.1 | -7,001.4 |
| WACC, % | 4.53 | 4.53 | 4.06 | 4.53 | 4.53 | 4.44 | 4.44 | 4.44 | 4.44 | 4.44 |
| PV UFCF | ||||||||||
| SUM PV UFCF | -15,048.6 | |||||||||
| Long Term Growth Rate, % | 2.00 | |||||||||
| Free cash flow (T + 1) | -7,141 | |||||||||
| Terminal Value | -292,996 | |||||||||
| Present Terminal Value | -235,821 | |||||||||
| Enterprise Value | -250,870 | |||||||||
| Net Debt | 332 | |||||||||
| Equity Value | -251,202 | |||||||||
| Diluted Shares Outstanding, MM | 263 | |||||||||
| Equity Value Per Share | -955.25 |
Your Benefits
- Genuine Zhuhai Enpower Data: Comprehensive financials – from revenue to EBIT – derived from both historical and forecasted information.
- Complete Customization: Modify essential parameters (yellow cells) such as WACC, growth %, and tax rates.
- Real-Time Valuation Adjustments: Automatic recalculations that help assess the effect of changes on Zhuhai Enpower's fair value.
- Flexible Excel Template: Designed for easy modifications, scenario analysis, and in-depth projections.
- Efficient and Precise: Eliminate the need to create models from the ground up while ensuring accuracy and adaptability.
Key Features
- Comprehensive DCF Calculator: Features detailed unlevered and levered DCF valuation models tailored for Zhuhai Enpower Electric Co., Ltd. (300681SZ).
- Customized WACC Calculator: Pre-designed Weighted Average Cost of Capital sheet with adjustable inputs for accurate assessments.
- Flexible Forecast Assumptions: Easily modify growth rates, capital expenditures, and discount rates to suit various scenarios.
- Integrated Financial Ratios: Evaluate profitability, leverage, and efficiency ratios specifically for Zhuhai Enpower Electric Co., Ltd. (300681SZ).
- Interactive Dashboard and Charts: Visual representations to summarize essential valuation metrics for straightforward analysis.
How It Functions
- Download: Obtain the pre-prepared Excel file containing Zhuhai Enpower Electric Co., Ltd.'s financial data (300681SZ).
- Customize: Modify forecasts, such as revenue growth, EBITDA percentages, and WACC.
- Update Automatically: Enjoy real-time updates of intrinsic value and NPV calculations.
- Test Scenarios: Generate various projections and instantly compare the results.
- Make Decisions: Utilize the valuation outcomes to inform your investment strategy.
Why Choose Zhuhai Enpower Electric Co., Ltd. (300681SZ)?
- Precision: Utilize authentic financial data for unmatched accuracy.
- Adaptability: Built for users to effortlessly adjust and explore various inputs.
- Efficiency: Avoid the complexity of constructing a financial model from the ground up.
- High-Quality Standards: Crafted with the expertise and reliability expected by industry leaders.
- Intuitive Interface: Designed to be straightforward, catering to both novices and seasoned financial analysts.
Who Can Benefit from This Product?
- Electrical Engineering Students: Master design principles and apply them to real-world projects.
- Researchers: Integrate industry-leading models into your studies or presentations.
- Investors: Analyze your investment strategies and evaluate performance metrics for Zhuhai Enpower Electric Co.,Ltd. (300681SZ).
- Industry Analysts: Enhance your analysis with a ready-to-use, customizable financial model.
- Small Business Owners: Understand how large-scale electric companies like Zhuhai Enpower are assessed within the market.
Contents of the Template
- In-Depth DCF Model: Editable template featuring thorough valuation computations.
- Market Data: Zhuhai Enpower Electric Co., Ltd.’s historical and forecasted financials preloaded for analysis.
- Adjustable Inputs: Modify WACC, growth rates, and tax parameters to explore various scenarios.
- Financial Statements: Comprehensive annual and quarterly breakdowns for enhanced insights.
- Essential Ratios: Integrated analysis for profitability, efficiency, and debt levels.
- Visual Dashboard: Graphs and tables providing clear, actionable insights.
Disclaimer
All information, articles, and product details provided on this website are for general informational and educational purposes only. We do not claim any ownership over, nor do we intend to infringe upon, any trademarks, copyrights, logos, brand names, or other intellectual property mentioned or depicted on this site. Such intellectual property remains the property of its respective owners, and any references here are made solely for identification or informational purposes, without implying any affiliation, endorsement, or partnership.
We make no representations or warranties, express or implied, regarding the accuracy, completeness, or suitability of any content or products presented. Nothing on this website should be construed as legal, tax, investment, financial, medical, or other professional advice. In addition, no part of this site—including articles or product references—constitutes a solicitation, recommendation, endorsement, advertisement, or offer to buy or sell any securities, franchises, or other financial instruments, particularly in jurisdictions where such activity would be unlawful.
All content is of a general nature and may not address the specific circumstances of any individual or entity. It is not a substitute for professional advice or services. Any actions you take based on the information provided here are strictly at your own risk. You accept full responsibility for any decisions or outcomes arising from your use of this website and agree to release us from any liability in connection with your use of, or reliance upon, the content or products found herein.