
|
Jones Tech plc (300684.sz) Avaliação DCF |
Totalmente Editável: Adapte-Se Às Suas Necessidades No Excel Ou Planilhas
Design Profissional: Modelos Confiáveis E Padrão Da Indústria
Pré-Construídos Para Uso Rápido E Eficiente
Compatível com MAC/PC, totalmente desbloqueado
Não É Necessária Experiência; Fácil De Seguir
Jones Tech PLC (300684.SZ) Bundle
Simplifique a avaliação Jones Tech Plc (300684SZ) com esta calculadora DCF personalizável! Com o Real Jones Tech Plc (300684SZ) financeiras e insumos de previsão ajustáveis, você pode testar cenários e descobrir o valor justo Jones Tech Plc (300684SZ) em minutos.
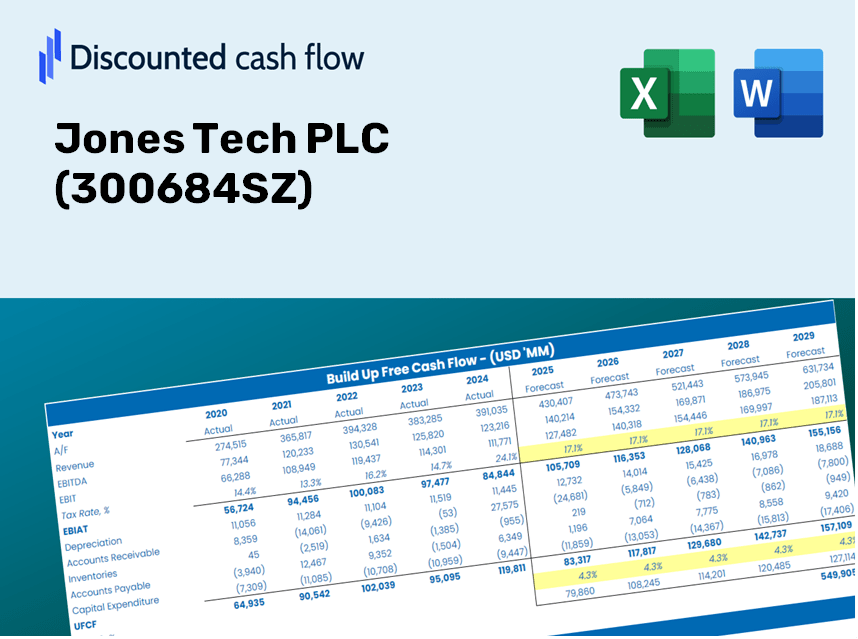
Discounted Cash Flow (DCF) - (USD MM)
| Year | AY1 2020 |
AY2 2021 |
AY3 2022 |
AY4 2023 |
AY5 2024 |
FY1 2025 |
FY2 2026 |
FY3 2027 |
FY4 2028 |
FY5 2029 |
|---|---|---|---|---|---|---|---|---|---|---|
| Revenue | 1,148.6 | 1,247.6 | 1,592.2 | 1,257.9 | 1,566.3 | 1,722.0 | 1,893.1 | 2,081.3 | 2,288.2 | 2,515.6 |
| Revenue Growth, % | 0 | 8.62 | 27.62 | -20.99 | 24.51 | 9.94 | 9.94 | 9.94 | 9.94 | 9.94 |
| EBITDA | 245.6 | 162.2 | 260.0 | 135.0 | 270.5 | 271.1 | 298.0 | 327.7 | 360.2 | 396.0 |
| EBITDA, % | 21.38 | 13 | 16.33 | 10.73 | 17.27 | 15.74 | 15.74 | 15.74 | 15.74 | 15.74 |
| Depreciation | 31.4 | 40.9 | 50.6 | 61.0 | 59.3 | 61.4 | 67.5 | 74.2 | 81.6 | 89.7 |
| Depreciation, % | 2.73 | 3.28 | 3.18 | 4.85 | 3.79 | 3.56 | 3.56 | 3.56 | 3.56 | 3.56 |
| EBIT | 214.2 | 121.3 | 209.4 | 74.1 | 211.2 | 209.7 | 230.6 | 253.5 | 278.7 | 306.4 |
| EBIT, % | 18.64 | 9.72 | 13.15 | 5.89 | 13.49 | 12.18 | 12.18 | 12.18 | 12.18 | 12.18 |
| Total Cash | 1,066.8 | 826.6 | 933.1 | 1,026.6 | 1,170.2 | 1,288.2 | 1,416.3 | 1,557.1 | 1,711.8 | 1,882.0 |
| Total Cash, percent | .0 | .0 | .0 | .0 | .0 | .0 | .0 | .0 | .0 | .0 |
| Account Receivables | 366.1 | 357.8 | 410.6 | 331.9 | 486.1 | 495.1 | 544.3 | 598.4 | 657.9 | 723.3 |
| Account Receivables, % | 31.88 | 28.68 | 25.79 | 26.38 | 31.03 | 28.75 | 28.75 | 28.75 | 28.75 | 28.75 |
| Inventories | 116.9 | 151.8 | 191.5 | 150.9 | 159.4 | 194.7 | 214.1 | 235.4 | 258.8 | 284.5 |
| Inventories, % | 10.18 | 12.17 | 12.03 | 12 | 10.18 | 11.31 | 11.31 | 11.31 | 11.31 | 11.31 |
| Accounts Payable | 212.6 | 181.5 | 375.0 | 304.8 | 376.3 | 361.2 | 397.0 | 436.5 | 479.9 | 527.6 |
| Accounts Payable, % | 18.51 | 14.55 | 23.55 | 24.23 | 24.03 | 20.97 | 20.97 | 20.97 | 20.97 | 20.97 |
| Capital Expenditure | -112.0 | -227.3 | -128.4 | -79.4 | -61.5 | -159.4 | -175.2 | -192.6 | -211.8 | -232.8 |
| Capital Expenditure, % | -9.75 | -18.22 | -8.07 | -6.31 | -3.93 | -9.25 | -9.25 | -9.25 | -9.25 | -9.25 |
| Tax Rate, % | 14.96 | 14.96 | 14.96 | 14.96 | 14.96 | 14.96 | 14.96 | 14.96 | 14.96 | 14.96 |
| EBITAT | 184.9 | 109.6 | 186.6 | 59.2 | 179.7 | 180.7 | 198.6 | 218.4 | 240.1 | 264.0 |
| Depreciation | ||||||||||
| Changes in Account Receivables | ||||||||||
| Changes in Inventories | ||||||||||
| Changes in Accounts Payable | ||||||||||
| Capital Expenditure | ||||||||||
| UFCF | -166.1 | -134.5 | 209.8 | 89.9 | 86.2 | 23.2 | 58.2 | 64.0 | 70.4 | 77.4 |
| WACC, % | 5.31 | 5.31 | 5.31 | 5.31 | 5.31 | 5.31 | 5.31 | 5.31 | 5.31 | 5.31 |
| PV UFCF | ||||||||||
| SUM PV UFCF | 246.4 | |||||||||
| Long Term Growth Rate, % | 3.50 | |||||||||
| Free cash flow (T + 1) | 80 | |||||||||
| Terminal Value | 4,430 | |||||||||
| Present Terminal Value | 3,420 | |||||||||
| Enterprise Value | 3,667 | |||||||||
| Net Debt | -320 | |||||||||
| Equity Value | 3,986 | |||||||||
| Diluted Shares Outstanding, MM | 298 | |||||||||
| Equity Value Per Share | 13.38 |
What You Will Receive
- Authentic JONES Financial Data: Pre-filled with Jones Tech's historical and projected metrics for accurate analysis.
- Completely Customizable Template: Easily adjust essential inputs like revenue growth, WACC, and EBITDA percentage.
- Instant Calculations: Watch Jones Tech’s intrinsic value refresh immediately based on your inputs.
- Professional Valuation Tool: Crafted for investors, analysts, and consultants aiming for precise DCF evaluations.
- User-Friendly Interface: Intuitive layout and straightforward instructions suitable for all skill levels.
Key Features
- Comprehensive Jones Tech Data: Pre-loaded with historical financials and forward-looking forecasts for Jones Tech PLC.
- Flexible Input Options: Modify parameters such as revenue growth, profit margins, WACC, tax rates, and capital expenditures to suit your analysis.
- Adaptive Valuation Model: Instant updates to Net Present Value (NPV) and intrinsic value based on user-defined inputs.
- Scenario Simulation: Generate various forecasting scenarios to explore different valuation results.
- User-Centric Interface: Designed to be intuitive and structured, catering to both seasoned professionals and newcomers.
How It Works
- Step 1: Download the Excel file.
- Step 2: Examine the pre-filled financial data and forecasts for Jones Tech PLC (300684SZ).
- Step 3: Adjust key parameters such as revenue growth, WACC, and tax rates (highlighted cells).
- Step 4: Observe the DCF model refresh in real-time as you modify your assumptions.
- Step 5: Evaluate the results and apply your findings to guide investment decisions.
Why Opt for This Calculator?
- Precise Data: Utilize real financials from Jones Tech PLC (300684SZ) for trustworthy valuation outcomes.
- Tailorable: Modify crucial parameters such as growth rates, WACC, and tax rates to align with your forecasts.
- Efficiency: Built-in calculations save you the hassle of starting from the ground up.
- Professional-Quality Tool: Crafted for investors, analysts, and consultants alike.
- Easy to Use: Intuitive design and guided instructions ensure accessibility for all users.
Who Can Benefit from Jones Tech PLC (300684SZ)?
- Investors: Make informed choices with a top-tier valuation tool tailored for your needs.
- Financial Analysts: Enhance efficiency using a customizable, pre-designed DCF model.
- Consultants: Effortlessly modify the template for client presentations or detailed reports.
- Finance Enthusiasts: Expand your knowledge of valuation methodologies through practical examples.
- Educators and Students: Leverage it as a hands-on learning resource in finance courses.
Contents of the Template
- Operating and Balance Sheet Data: Pre-filled historical data and forecasts for Jones Tech PLC (300684SZ), covering metrics such as revenue, EBITDA, EBIT, and capital expenditures.
- WACC Calculation: A dedicated sheet for the Weighted Average Cost of Capital (WACC), detailing parameters like Beta, the risk-free rate, and share price.
- DCF Valuation (Unlevered and Levered): Customizable Discounted Cash Flow models that illustrate intrinsic value with comprehensive calculations.
- Financial Statements: Pre-loaded financial statements (annual and quarterly) to facilitate thorough analysis.
- Key Ratios: Includes profitability, leverage, and efficiency ratios specific to Jones Tech PLC (300684SZ).
- Dashboard and Charts: Visual representations of valuation outputs and assumptions, simplifying the analysis of results.
Disclaimer
All information, articles, and product details provided on this website are for general informational and educational purposes only. We do not claim any ownership over, nor do we intend to infringe upon, any trademarks, copyrights, logos, brand names, or other intellectual property mentioned or depicted on this site. Such intellectual property remains the property of its respective owners, and any references here are made solely for identification or informational purposes, without implying any affiliation, endorsement, or partnership.
We make no representations or warranties, express or implied, regarding the accuracy, completeness, or suitability of any content or products presented. Nothing on this website should be construed as legal, tax, investment, financial, medical, or other professional advice. In addition, no part of this site—including articles or product references—constitutes a solicitation, recommendation, endorsement, advertisement, or offer to buy or sell any securities, franchises, or other financial instruments, particularly in jurisdictions where such activity would be unlawful.
All content is of a general nature and may not address the specific circumstances of any individual or entity. It is not a substitute for professional advice or services. Any actions you take based on the information provided here are strictly at your own risk. You accept full responsibility for any decisions or outcomes arising from your use of this website and agree to release us from any liability in connection with your use of, or reliance upon, the content or products found herein.