
|
AMOY Diagnostics Co., Ltd. (300685.SZ) Avaliação DCF |
Totalmente Editável: Adapte-Se Às Suas Necessidades No Excel Ou Planilhas
Design Profissional: Modelos Confiáveis E Padrão Da Indústria
Pré-Construídos Para Uso Rápido E Eficiente
Compatível com MAC/PC, totalmente desbloqueado
Não É Necessária Experiência; Fácil De Seguir
Amoy Diagnostics Co., Ltd. (300685.SZ) Bundle
Explore o potencial financeiro da Amoy Diagnostics Co., Ltd. (300685SZ) com nossa calculadora DCF amigável! Digite suas projeções de crescimento, margens e despesas para descobrir o valor intrínseco da Amoy Diagnostics Co., Ltd. (300685SZ) e refine sua abordagem de investimento.
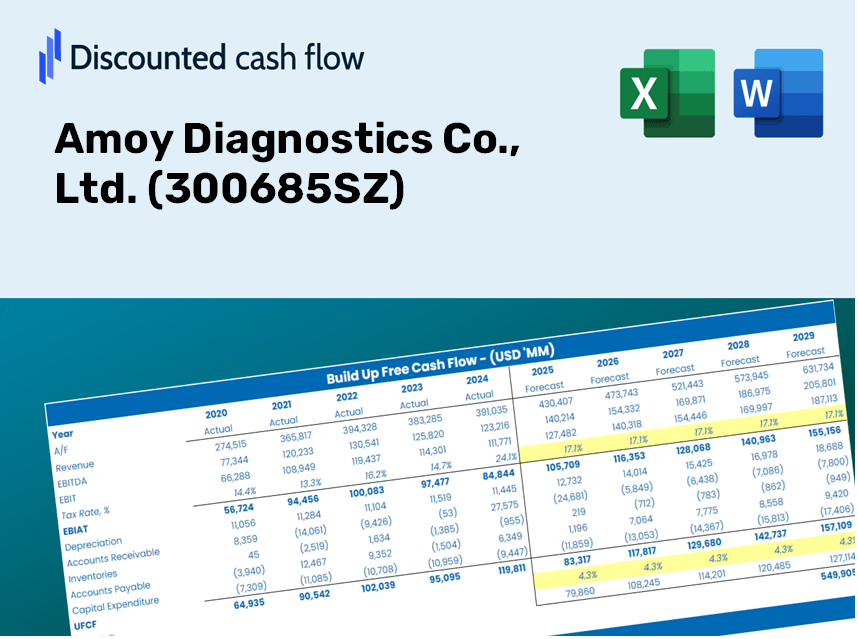
Discounted Cash Flow (DCF) - (USD MM)
| Year | AY1 2020 |
AY2 2021 |
AY3 2022 |
AY4 2023 |
AY5 2024 |
FY1 2025 |
FY2 2026 |
FY3 2027 |
FY4 2028 |
FY5 2029 |
|---|---|---|---|---|---|---|---|---|---|---|
| Revenue | 728.4 | 917.0 | 842.2 | 1,043.5 | 1,108.9 | 1,241.8 | 1,390.5 | 1,557.1 | 1,743.6 | 1,952.4 |
| Revenue Growth, % | 0 | 25.9 | -8.16 | 23.91 | 6.27 | 11.98 | 11.98 | 11.98 | 11.98 | 11.98 |
| EBITDA | 203.3 | 271.5 | 191.5 | 322.2 | 323.2 | 348.4 | 390.1 | 436.8 | 489.2 | 547.8 |
| EBITDA, % | 27.91 | 29.61 | 22.73 | 30.88 | 29.15 | 28.06 | 28.06 | 28.06 | 28.06 | 28.06 |
| Depreciation | 27.3 | 36.4 | 47.8 | 52.8 | 46.0 | 56.2 | 62.9 | 70.4 | 78.8 | 88.3 |
| Depreciation, % | 3.75 | 3.97 | 5.68 | 5.06 | 4.15 | 4.52 | 4.52 | 4.52 | 4.52 | 4.52 |
| EBIT | 175.9 | 235.0 | 143.6 | 269.5 | 277.3 | 292.2 | 327.2 | 366.4 | 410.3 | 459.5 |
| EBIT, % | 24.16 | 25.63 | 17.06 | 25.82 | 25 | 23.53 | 23.53 | 23.53 | 23.53 | 23.53 |
| Total Cash | 666.4 | 718.7 | 754.0 | 1,021.9 | 1,180.8 | 1,135.8 | 1,271.8 | 1,424.2 | 1,594.8 | 1,785.8 |
| Total Cash, percent | .0 | .0 | .0 | .0 | .0 | .0 | .0 | .0 | .0 | .0 |
| Account Receivables | 319.3 | 434.7 | 468.5 | 537.0 | 545.6 | 614.8 | 688.4 | 770.9 | 863.2 | 966.6 |
| Account Receivables, % | 43.83 | 47.4 | 55.63 | 51.46 | 49.2 | 49.51 | 49.51 | 49.51 | 49.51 | 49.51 |
| Inventories | 21.4 | 32.3 | 32.8 | 28.8 | 34.4 | 40.3 | 45.1 | 50.5 | 56.6 | 63.3 |
| Inventories, % | 2.94 | 3.52 | 3.9 | 2.76 | 3.1 | 3.24 | 3.24 | 3.24 | 3.24 | 3.24 |
| Accounts Payable | 14.0 | 24.0 | 21.3 | 17.9 | 19.7 | 26.3 | 29.4 | 32.9 | 36.9 | 41.3 |
| Accounts Payable, % | 1.93 | 2.62 | 2.53 | 1.72 | 1.78 | 2.11 | 2.11 | 2.11 | 2.11 | 2.11 |
| Capital Expenditure | -57.9 | -74.5 | -78.3 | -44.9 | -40.2 | -82.7 | -92.6 | -103.7 | -116.1 | -130.0 |
| Capital Expenditure, % | -7.95 | -8.13 | -9.3 | -4.3 | -3.63 | -6.66 | -6.66 | -6.66 | -6.66 | -6.66 |
| Tax Rate, % | 12.08 | 12.08 | 12.08 | 12.08 | 12.08 | 12.08 | 12.08 | 12.08 | 12.08 | 12.08 |
| EBITAT | 158.1 | 223.5 | 132.4 | 239.0 | 243.8 | 265.2 | 296.9 | 332.5 | 372.3 | 416.9 |
| Depreciation | ||||||||||
| Changes in Account Receivables | ||||||||||
| Changes in Inventories | ||||||||||
| Changes in Accounts Payable | ||||||||||
| Capital Expenditure | ||||||||||
| UFCF | -199.1 | 69.1 | 64.9 | 179.0 | 237.1 | 170.2 | 191.9 | 214.9 | 240.6 | 269.4 |
| WACC, % | 6.68 | 6.68 | 6.68 | 6.68 | 6.68 | 6.68 | 6.68 | 6.68 | 6.68 | 6.68 |
| PV UFCF | ||||||||||
| SUM PV UFCF | 885.8 | |||||||||
| Long Term Growth Rate, % | 3.00 | |||||||||
| Free cash flow (T + 1) | 278 | |||||||||
| Terminal Value | 7,536 | |||||||||
| Present Terminal Value | 5,454 | |||||||||
| Enterprise Value | 6,339 | |||||||||
| Net Debt | -820 | |||||||||
| Equity Value | 7,160 | |||||||||
| Diluted Shares Outstanding, MM | 398 | |||||||||
| Equity Value Per Share | 17.98 |
Benefits You Will Receive
- Flexible Forecast Variables: Effortlessly adjust key inputs (growth %, margins, WACC) to generate various projections.
- Comprehensive Data Insights: Amoy Diagnostics’ financial information pre-loaded to facilitate your analysis.
- Automated DCF Calculations: The model computes Net Present Value (NPV) and intrinsic value for you automatically.
- Tailorable and Professional Design: A refined Excel template that conforms to your valuation requirements.
- Designed for Analysts and Investors: Perfect for testing forecasts, assessing strategies, and enhancing efficiency.
Key Features
- Real-Time Aoy Diagnostics Data: Pre-populated with Amoy Diagnostics' historical financial data and future growth projections.
- Fully Customizable Variables: Modify revenue growth rates, profit margins, discount rates, tax rates, and capital investment estimates.
- Dynamic Valuation Framework: Instantaneous recalculations of Net Present Value (NPV) and intrinsic value based on your selected parameters.
- Scenario Analysis: Develop various forecast scenarios to explore different valuation possibilities.
- Intuitive Interface: Easy-to-navigate design suitable for both seasoned professionals and newcomers.
How It Works
- Step 1: Download the Excel file.
- Step 2: Examine the pre-loaded Amoy Diagnostics data (historical and projected).
- Step 3: Modify key assumptions (highlighted in yellow) according to your insights.
- Step 4: Observe the automatic updates reflecting Amoy Diagnostics' intrinsic value.
- Step 5: Utilize the results for investment decisions or reporting purposes.
Why Choose Amoy Diagnostics Co., Ltd. (300685SZ)?
- Precision: Utilizes real Amoy Diagnostics financial data for reliable outcomes.
- Adaptability: Created for users to experiment with and adjust inputs effortlessly.
- Efficiency: Avoid the complexities of building a financial model from the ground up.
- Expert-Level Quality: Crafted with the expertise and attention to detail expected at the CFO level.
- Intuitive Design: Simple to navigate, suitable for users without extensive financial modeling knowledge.
Who Can Benefit from This Product?
- Professional Investors: Create comprehensive and dependable valuation models for analyzing portfolios centered on Amoy Diagnostics Co., Ltd. (300685SZ).
- Corporate Finance Teams: Examine valuation scenarios to inform strategic decisions within their organizations.
- Consultants and Advisors: Equip clients with precise valuation insights related to Amoy Diagnostics Co., Ltd. (300685SZ).
- Students and Educators: Utilize real-time data to enhance financial modeling skills and instruction.
- Biotech Enthusiasts: Gain insights into the market valuation of biotech companies like Amoy Diagnostics Co., Ltd. (300685SZ).
What This Template Includes
- Pre-Filled Data: Contains Amoy Diagnostics' historical financials and projections.
- Discounted Cash Flow Model: Customizable DCF valuation model with automated calculations.
- Weighted Average Cost of Capital (WACC): A specific sheet to compute WACC with user-defined inputs.
- Key Financial Ratios: Evaluate Amoy Diagnostics' profitability, efficiency, and financial leverage.
- Customizable Inputs: Easily modify revenue growth, profit margins, and tax rates.
- Concise Dashboard: Visuals and tables that summarize essential valuation outcomes.
Disclaimer
All information, articles, and product details provided on this website are for general informational and educational purposes only. We do not claim any ownership over, nor do we intend to infringe upon, any trademarks, copyrights, logos, brand names, or other intellectual property mentioned or depicted on this site. Such intellectual property remains the property of its respective owners, and any references here are made solely for identification or informational purposes, without implying any affiliation, endorsement, or partnership.
We make no representations or warranties, express or implied, regarding the accuracy, completeness, or suitability of any content or products presented. Nothing on this website should be construed as legal, tax, investment, financial, medical, or other professional advice. In addition, no part of this site—including articles or product references—constitutes a solicitation, recommendation, endorsement, advertisement, or offer to buy or sell any securities, franchises, or other financial instruments, particularly in jurisdictions where such activity would be unlawful.
All content is of a general nature and may not address the specific circumstances of any individual or entity. It is not a substitute for professional advice or services. Any actions you take based on the information provided here are strictly at your own risk. You accept full responsibility for any decisions or outcomes arising from your use of this website and agree to release us from any liability in connection with your use of, or reliance upon, the content or products found herein.