
|
Union Optech Co., Ltd. (300691.sz) Avaliação do DCF |
Totalmente Editável: Adapte-Se Às Suas Necessidades No Excel Ou Planilhas
Design Profissional: Modelos Confiáveis E Padrão Da Indústria
Pré-Construídos Para Uso Rápido E Eficiente
Compatível com MAC/PC, totalmente desbloqueado
Não É Necessária Experiência; Fácil De Seguir
Union Optech Co.,Ltd. (300691.SZ) Bundle
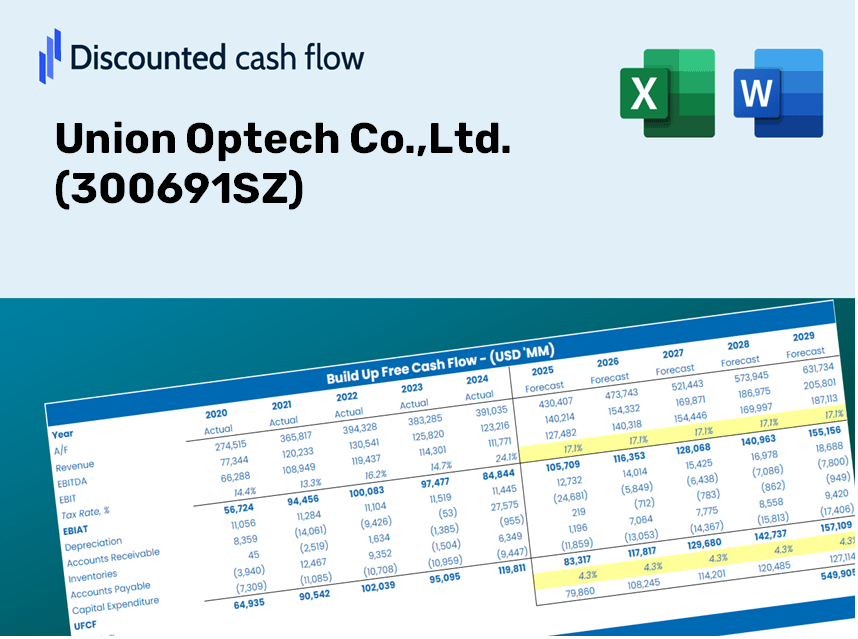
Otimize seu tempo e melhore a precisão com a nossa calculadora DCF (300691SZ)! Com dados reais da Union Optech Co., Ltd. e suposições personalizáveis, essa ferramenta o capacita a prever, analisar e valorizar a Union Optech como um investidor experiente.
Discounted Cash Flow (DCF) - (USD MM)
| Year | AY1 2020 |
AY2 2021 |
AY3 2022 |
AY4 2023 |
AY5 2024 |
FY1 2025 |
FY2 2026 |
FY3 2027 |
FY4 2028 |
FY5 2029 |
|---|---|---|---|---|---|---|---|---|---|---|
| Revenue | 1,288.3 | 1,635.2 | 1,504.6 | 1,647.1 | 1,880.2 | 2,080.2 | 2,301.6 | 2,546.5 | 2,817.5 | 3,117.3 |
| Revenue Growth, % | 0 | 26.93 | -7.99 | 9.47 | 14.15 | 10.64 | 10.64 | 10.64 | 10.64 | 10.64 |
| EBITDA | 93.1 | 137.0 | 136.4 | 148.0 | 141.6 | 171.4 | 189.6 | 209.8 | 232.1 | 256.8 |
| EBITDA, % | 7.23 | 8.38 | 9.07 | 8.98 | 7.53 | 8.24 | 8.24 | 8.24 | 8.24 | 8.24 |
| Depreciation | 41.3 | 53.9 | 64.5 | 73.5 | 84.7 | 82.2 | 90.9 | 100.6 | 111.3 | 123.1 |
| Depreciation, % | 3.2 | 3.3 | 4.29 | 4.46 | 4.5 | 3.95 | 3.95 | 3.95 | 3.95 | 3.95 |
| EBIT | 51.8 | 83.0 | 72.0 | 74.5 | 56.9 | 89.2 | 98.7 | 109.2 | 120.8 | 133.6 |
| EBIT, % | 4.02 | 5.08 | 4.78 | 4.52 | 3.03 | 4.29 | 4.29 | 4.29 | 4.29 | 4.29 |
| Total Cash | 235.3 | 633.1 | 483.7 | 469.7 | 367.1 | 570.7 | 631.5 | 698.7 | 773.0 | 855.3 |
| Total Cash, percent | .0 | .0 | .0 | .0 | .0 | .0 | .0 | .0 | .0 | .0 |
| Account Receivables | 549.3 | 526.3 | 483.8 | 544.2 | 694.6 | 736.2 | 814.6 | 901.3 | 997.2 | 1,103.3 |
| Account Receivables, % | 42.64 | 32.19 | 32.15 | 33.04 | 36.94 | 35.39 | 35.39 | 35.39 | 35.39 | 35.39 |
| Inventories | 237.2 | 401.2 | 381.2 | 366.6 | 429.6 | 471.8 | 522.0 | 577.5 | 638.9 | 706.9 |
| Inventories, % | 18.41 | 24.54 | 25.34 | 22.25 | 22.85 | 22.68 | 22.68 | 22.68 | 22.68 | 22.68 |
| Accounts Payable | 424.6 | 431.7 | 309.1 | 374.2 | 524.8 | 543.1 | 600.9 | 664.9 | 735.6 | 813.9 |
| Accounts Payable, % | 32.96 | 26.4 | 20.54 | 22.72 | 27.91 | 26.11 | 26.11 | 26.11 | 26.11 | 26.11 |
| Capital Expenditure | -154.2 | -260.3 | -166.7 | -139.0 | -288.3 | -261.0 | -288.8 | -319.5 | -353.5 | -391.2 |
| Capital Expenditure, % | -11.97 | -15.92 | -11.08 | -8.44 | -15.33 | -12.55 | -12.55 | -12.55 | -12.55 | -12.55 |
| Tax Rate, % | 14.26 | 14.26 | 14.26 | 14.26 | 14.26 | 14.26 | 14.26 | 14.26 | 14.26 | 14.26 |
| EBITAT | 54.2 | 75.5 | 60.7 | 66.5 | 48.8 | 80.3 | 88.9 | 98.3 | 108.8 | 120.4 |
| Depreciation | ||||||||||
| Changes in Account Receivables | ||||||||||
| Changes in Inventories | ||||||||||
| Changes in Accounts Payable | ||||||||||
| Capital Expenditure | ||||||||||
| UFCF | -420.5 | -264.9 | -101.6 | 20.3 | -217.6 | -164.1 | -179.8 | -198.9 | -220.1 | -243.5 |
| WACC, % | 5.91 | 5.87 | 5.85 | 5.87 | 5.85 | 5.87 | 5.87 | 5.87 | 5.87 | 5.87 |
| PV UFCF | ||||||||||
| SUM PV UFCF | -841.2 | |||||||||
| Long Term Growth Rate, % | 3.50 | |||||||||
| Free cash flow (T + 1) | -252 | |||||||||
| Terminal Value | -10,632 | |||||||||
| Present Terminal Value | -7,994 | |||||||||
| Enterprise Value | -8,835 | |||||||||
| Net Debt | 374 | |||||||||
| Equity Value | -9,209 | |||||||||
| Diluted Shares Outstanding, MM | 275 | |||||||||
| Equity Value Per Share | -33.43 |
Benefits You Will Experience
- Flexible Forecast Inputs: Seamlessly adjust key parameters (growth %, profit margins, WACC) to generate various financial scenarios.
- Real-Time Data: Union Optech's financial figures are pre-loaded to facilitate your analysis.
- Automated DCF Calculations: The model automatically computes Net Present Value (NPV) and intrinsic value for your convenience.
- Customizable and Professional Design: A sophisticated Excel template tailored to meet your valuation requirements.
- Engineered for Analysts and Investors: Perfect for evaluating projections, verifying strategies, and enhancing efficiency.
Key Features
- 🔍 Real-Life Union Optech Financials: Pre-filled historical and projected data for Union Optech Co., Ltd. (300691SZ).
- ✏️ Fully Customizable Inputs: Adjust all critical parameters (yellow cells) such as WACC, growth %, and tax rates.
- 📊 Professional DCF Valuation: Built-in formulas compute Union Optech's intrinsic value using the Discounted Cash Flow method.
- ⚡ Instant Results: Visualize Union Optech’s valuation instantly after making adjustments.
- Scenario Analysis: Test and compare outcomes for various financial assumptions side-by-side.
How It Operates
- 1. Access the Template: Download and open the Excel file featuring Union Optech Co., Ltd.’s (300691SZ) preloaded data.
- 2. Adjust Assumptions: Modify key inputs such as growth rates, WACC, and capital expenses.
- 3. Review Results Immediately: The DCF model automatically computes intrinsic value and NPV.
- 4. Explore Scenarios: Evaluate multiple forecasts to understand various valuation possibilities.
- 5. Present with Assurance: Deliver professional valuation insights to bolster your decision-making.
Why Select Union Optech Co., Ltd. ([300691SZ]) Calculator?
- All-in-One Tool: Features DCF, WACC, and financial ratio analyses in a single interface.
- Adjustable Parameters: Modify the yellow-highlighted fields to explore different scenarios.
- In-Depth Analysis: Automatically computes the intrinsic value and Net Present Value for Union Optech Co., Ltd.
- Prepopulated Information: Historical and projected data provide reliable starting points.
- High-Quality Standards: Perfect for financial analysts, investors, and business consultants.
Who Can Benefit from Union Optech Co., Ltd. (300691SZ)?
- Investors: Gain assurance in your investment choices with our advanced valuation tool.
- Financial Analysts: Streamline your workflow with a customizable, ready-to-use DCF model.
- Consultants: Effortlessly modify the template for client presentations and detailed reports.
- Finance Enthusiasts: Enhance your knowledge of valuation methods through practical, real-world examples.
- Educators and Students: Utilize this resource as a hands-on learning aid in finance courses.
Contents of the Template
- Pre-Filled DCF Model: Financial data for Union Optech Co., Ltd. (300691SZ) preloaded for immediate application.
- WACC Calculator: Comprehensive calculations for Weighted Average Cost of Capital.
- Financial Ratios: Assess Union Optech's profitability, leverage, and operational efficiency.
- Editable Inputs: Modify assumptions like growth rates, profit margins, and capital expenditures to suit your analysis.
- Financial Statements: Access annual and quarterly reports for in-depth evaluation.
- Interactive Dashboard: Easily visualize key valuation metrics and outputs.
Disclaimer
All information, articles, and product details provided on this website are for general informational and educational purposes only. We do not claim any ownership over, nor do we intend to infringe upon, any trademarks, copyrights, logos, brand names, or other intellectual property mentioned or depicted on this site. Such intellectual property remains the property of its respective owners, and any references here are made solely for identification or informational purposes, without implying any affiliation, endorsement, or partnership.
We make no representations or warranties, express or implied, regarding the accuracy, completeness, or suitability of any content or products presented. Nothing on this website should be construed as legal, tax, investment, financial, medical, or other professional advice. In addition, no part of this site—including articles or product references—constitutes a solicitation, recommendation, endorsement, advertisement, or offer to buy or sell any securities, franchises, or other financial instruments, particularly in jurisdictions where such activity would be unlawful.
All content is of a general nature and may not address the specific circumstances of any individual or entity. It is not a substitute for professional advice or services. Any actions you take based on the information provided here are strictly at your own risk. You accept full responsibility for any decisions or outcomes arising from your use of this website and agree to release us from any liability in connection with your use of, or reliance upon, the content or products found herein.