
|
Shenzhen Sinexcel Electric Co., Ltd. (300693.SZ) Avaliação do DCF |
Totalmente Editável: Adapte-Se Às Suas Necessidades No Excel Ou Planilhas
Design Profissional: Modelos Confiáveis E Padrão Da Indústria
Pré-Construídos Para Uso Rápido E Eficiente
Compatível com MAC/PC, totalmente desbloqueado
Não É Necessária Experiência; Fácil De Seguir
Shenzhen Sinexcel Electric Co.,Ltd. (300693.SZ) Bundle
Aprimore suas opções de investimento com a calculadora DCF (300693SZ)! Utilize dados financeiros reais da Shenzhen Sinexcel Electric Co., Ltd., ajuste as previsões e despesas do crescimento e observe como essas modificações afetam o valor intrínseco de (300693SZ) em tempo real.
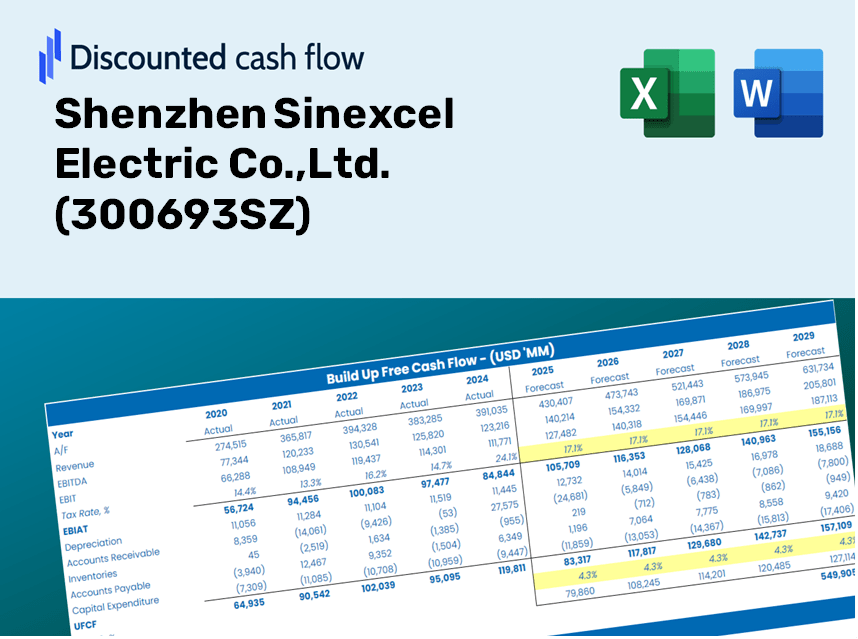
Discounted Cash Flow (DCF) - (USD MM)
| Year | AY1 2020 |
AY2 2021 |
AY3 2022 |
AY4 2023 |
AY5 2024 |
FY1 2025 |
FY2 2026 |
FY3 2027 |
FY4 2028 |
FY5 2029 |
|---|---|---|---|---|---|---|---|---|---|---|
| Revenue | 771.4 | 1,021.4 | 1,503.1 | 2,651.0 | 3,036.2 | 4,330.1 | 6,175.6 | 8,807.6 | 12,561.2 | 17,914.7 |
| Revenue Growth, % | 0 | 32.41 | 47.16 | 76.37 | 14.53 | 42.62 | 42.62 | 42.62 | 42.62 | 42.62 |
| EBITDA | 117.0 | 140.9 | 254.3 | 446.5 | 490.8 | 683.3 | 974.5 | 1,389.8 | 1,982.1 | 2,826.8 |
| EBITDA, % | 15.17 | 13.8 | 16.92 | 16.84 | 16.17 | 15.78 | 15.78 | 15.78 | 15.78 | 15.78 |
| Depreciation | 7.9 | 13.4 | 20.5 | 27.5 | 40.6 | 52.6 | 75.0 | 107.0 | 152.6 | 217.7 |
| Depreciation, % | 1.03 | 1.31 | 1.36 | 1.04 | 1.34 | 1.22 | 1.22 | 1.22 | 1.22 | 1.22 |
| EBIT | 109.1 | 127.6 | 233.8 | 419.0 | 450.2 | 630.6 | 899.4 | 1,282.7 | 1,829.4 | 2,609.1 |
| EBIT, % | 14.14 | 12.49 | 15.56 | 15.81 | 14.83 | 14.56 | 14.56 | 14.56 | 14.56 | 14.56 |
| Total Cash | 364.0 | 296.8 | 498.2 | 805.3 | 897.3 | 1,466.4 | 2,091.3 | 2,982.6 | 4,253.8 | 6,066.7 |
| Total Cash, percent | .0 | .0 | .0 | .0 | .0 | .0 | .0 | .0 | .0 | .0 |
| Account Receivables | 434.2 | 486.2 | 714.9 | 1,060.4 | 1,136.1 | 1,982.1 | 2,826.8 | 4,031.6 | 5,749.8 | 8,200.3 |
| Account Receivables, % | 56.3 | 47.6 | 47.56 | 40 | 37.42 | 45.77 | 45.77 | 45.77 | 45.77 | 45.77 |
| Inventories | 142.7 | 271.5 | 482.6 | 726.7 | 701.4 | 1,106.0 | 1,577.3 | 2,249.6 | 3,208.3 | 4,575.7 |
| Inventories, % | 18.5 | 26.59 | 32.1 | 27.41 | 23.1 | 25.54 | 25.54 | 25.54 | 25.54 | 25.54 |
| Accounts Payable | 309.7 | 423.2 | 650.7 | 1,117.8 | 565.7 | 1,608.0 | 2,293.3 | 3,270.7 | 4,664.6 | 6,652.5 |
| Accounts Payable, % | 40.15 | 41.44 | 43.29 | 42.17 | 18.63 | 37.13 | 37.13 | 37.13 | 37.13 | 37.13 |
| Capital Expenditure | -160.0 | -138.9 | -143.3 | -145.8 | -147.4 | -469.8 | -670.0 | -955.5 | -1,362.7 | -1,943.4 |
| Capital Expenditure, % | -20.75 | -13.6 | -9.53 | -5.5 | -4.85 | -10.85 | -10.85 | -10.85 | -10.85 | -10.85 |
| Tax Rate, % | 7.23 | 7.23 | 7.23 | 7.23 | 7.23 | 7.23 | 7.23 | 7.23 | 7.23 | 7.23 |
| EBITAT | 95.2 | 116.1 | 212.2 | 370.2 | 417.6 | 567.7 | 809.7 | 1,154.7 | 1,646.9 | 2,348.7 |
| Depreciation | ||||||||||
| Changes in Account Receivables | ||||||||||
| Changes in Inventories | ||||||||||
| Changes in Accounts Payable | ||||||||||
| Capital Expenditure | ||||||||||
| UFCF | -324.2 | -76.7 | -122.9 | 129.3 | -291.5 | -57.8 | -416.0 | -593.4 | -846.2 | -1,206.9 |
| WACC, % | 4.52 | 4.52 | 4.52 | 4.52 | 4.52 | 4.52 | 4.52 | 4.52 | 4.52 | 4.52 |
| PV UFCF | ||||||||||
| SUM PV UFCF | -2,632.6 | |||||||||
| Long Term Growth Rate, % | 4.00 | |||||||||
| Free cash flow (T + 1) | -1,255 | |||||||||
| Terminal Value | -241,981 | |||||||||
| Present Terminal Value | -194,004 | |||||||||
| Enterprise Value | -196,637 | |||||||||
| Net Debt | -315 | |||||||||
| Equity Value | -196,321 | |||||||||
| Diluted Shares Outstanding, MM | 310 | |||||||||
| Equity Value Per Share | -632.43 |
What You Will Receive
- Authentic Shenzhen Sinexcel Data: Comprehensive financials – from revenue to EBIT – derived from actual and projected metrics.
- Complete Customization: Modify essential parameters (highlighted cells) such as WACC, growth %, and tax rates to suit your analysis.
- Immediate Valuation Adjustments: Automated recalculations to evaluate how changes affect the fair value of Shenzhen Sinexcel (300693SZ).
- Flexible Excel Template: Designed for easy modifications, scenario analysis, and thorough forecasts.
- Efficient and Accurate: Avoid the hassle of constructing models from the ground up while ensuring accuracy and adaptability.
Core Features
- Comprehensive SZCE Financial Data: Includes historical financial performance and future projections for Shenzhen Sinexcel Electric Co., Ltd. (300693SZ).
- Customizable Parameters: Tailor inputs such as revenue growth rates, profit margins, WACC, tax rates, and capital investments.
- Interactive Valuation Model: Automatically refreshes Net Present Value (NPV) and intrinsic value based on your adjustments.
- Scenario Analysis: Develop various forecasting scenarios to assess different valuation possibilities.
- Intuitive Interface: Designed to be straightforward and accessible for both professionals and newcomers.
How It Works
- Step 1: Download the prebuilt Excel template featuring Shenzhen Sinexcel Electric Co., Ltd.'s data.
- Step 2: Navigate through the pre-filled sheets to familiarize yourself with the essential metrics.
- Step 3: Modify forecasts and assumptions in the editable yellow cells (WACC, growth, margins).
- Step 4: Instantly see recalculated results, including Shenzhen Sinexcel Electric Co., Ltd.'s intrinsic value.
- Step 5: Use the outputs to make well-informed investment choices or produce reports.
Why Opt for This Calculator?
- Reliable Data: Utilize genuine Shenzhen Sinexcel Electric Co., Ltd. financials for trustworthy valuation outcomes.
- Flexible Options: Tailor essential factors such as growth rates, WACC, and tax rates to fit your forecasts.
- Efficient: Built-in calculations save you from having to create a model from the ground up.
- Professional Tool: Crafted for investors, analysts, and consultants alike.
- Easy to Use: User-friendly design and clear, step-by-step guidance make it accessible for everyone.
Who Can Benefit from This Product?
- Investment Professionals: Create comprehensive and accurate valuation models for analyzing portfolios with Shenzhen Sinexcel Electric Co.,Ltd. (300693SZ).
- Corporate Financial Teams: Evaluate valuation scenarios to inform strategic decisions within the company.
- Consultants and Financial Advisors: Deliver precise valuation insights for clients interested in Shenzhen Sinexcel Electric Co.,Ltd. (300693SZ).
- Academics and Students: Utilize real-world financial data to learn and teach modeling techniques.
- Technology Aficionados: Gain insights into how companies like Shenzhen Sinexcel Electric Co.,Ltd. (300693SZ) are assessed in the financial markets.
Contents of the Template
- Preloaded 300693SZ Data: Historical and projected financial information, including revenue, EBIT, and capital expenditures.
- DCF and WACC Models: Advanced spreadsheets for determining intrinsic value and Weighted Average Cost of Capital.
- Editable Inputs: Yellow-highlighted cells for modifying revenue growth, tax rates, and discount rates.
- Financial Statements: Detailed annual and quarterly financial reports for in-depth analysis.
- Key Ratios: Metrics for profitability, leverage, and efficiency to assess performance.
- Dashboard and Charts: Visual representations of valuation results and underlying assumptions.
Disclaimer
All information, articles, and product details provided on this website are for general informational and educational purposes only. We do not claim any ownership over, nor do we intend to infringe upon, any trademarks, copyrights, logos, brand names, or other intellectual property mentioned or depicted on this site. Such intellectual property remains the property of its respective owners, and any references here are made solely for identification or informational purposes, without implying any affiliation, endorsement, or partnership.
We make no representations or warranties, express or implied, regarding the accuracy, completeness, or suitability of any content or products presented. Nothing on this website should be construed as legal, tax, investment, financial, medical, or other professional advice. In addition, no part of this site—including articles or product references—constitutes a solicitation, recommendation, endorsement, advertisement, or offer to buy or sell any securities, franchises, or other financial instruments, particularly in jurisdictions where such activity would be unlawful.
All content is of a general nature and may not address the specific circumstances of any individual or entity. It is not a substitute for professional advice or services. Any actions you take based on the information provided here are strictly at your own risk. You accept full responsibility for any decisions or outcomes arising from your use of this website and agree to release us from any liability in connection with your use of, or reliance upon, the content or products found herein.