
|
Jiangsu Gian Technology Co., Ltd. (300709.SZ) Avaliação DCF |
Totalmente Editável: Adapte-Se Às Suas Necessidades No Excel Ou Planilhas
Design Profissional: Modelos Confiáveis E Padrão Da Indústria
Pré-Construídos Para Uso Rápido E Eficiente
Compatível com MAC/PC, totalmente desbloqueado
Não É Necessária Experiência; Fácil De Seguir
Jiangsu Gian Technology Co., Ltd. (300709.SZ) Bundle
Aprimore sua estratégia de investimento com a calculadora DCF da Jiangsu Gian Technology Co., Ltd. (300709SZ)! Explore dados financeiros autênticos, ajuste as projeções e despesas de crescimento e observe instantaneamente como essas alterações afetam o valor intrínseco da Jiangsu Gian Technology Co., Ltd. (300709SZ).
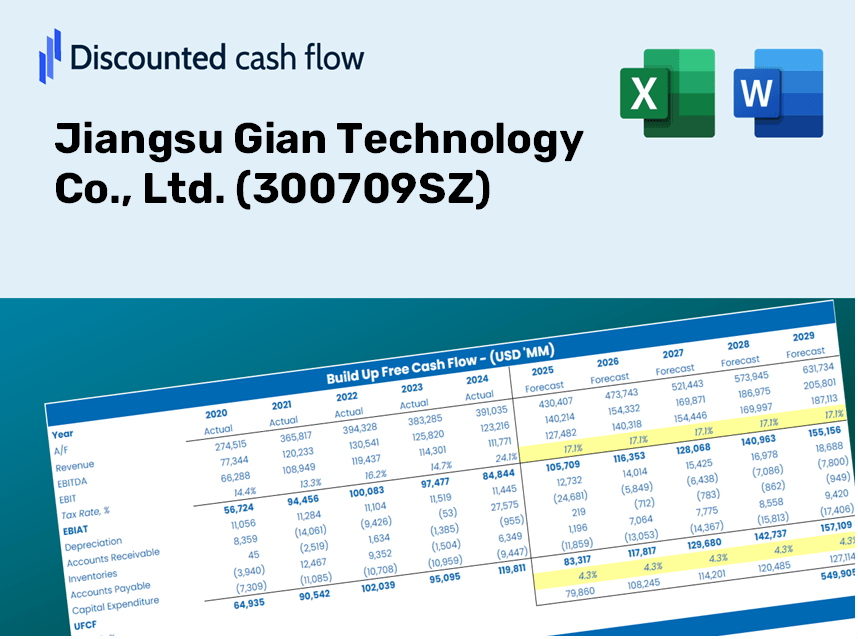
Discounted Cash Flow (DCF) - (USD MM)
| Year | AY1 2020 |
AY2 2021 |
AY3 2022 |
AY4 2023 |
AY5 2024 |
FY1 2025 |
FY2 2026 |
FY3 2027 |
FY4 2028 |
FY5 2029 |
|---|---|---|---|---|---|---|---|---|---|---|
| Revenue | 1,564.1 | 2,540.3 | 2,507.6 | 2,195.6 | 2,159.1 | 2,413.0 | 2,696.6 | 3,013.6 | 3,367.8 | 3,763.7 |
| Revenue Growth, % | 0 | 62.41 | -1.28 | -12.44 | -1.66 | 11.76 | 11.76 | 11.76 | 11.76 | 11.76 |
| EBITDA | 205.2 | 320.5 | 63.2 | 334.2 | 248.8 | 265.4 | 296.6 | 331.5 | 370.4 | 414.0 |
| EBITDA, % | 13.12 | 12.62 | 2.52 | 15.22 | 11.52 | 11 | 11 | 11 | 11 | 11 |
| Depreciation | 90.2 | 142.1 | 179.7 | 181.0 | 140.6 | 160.6 | 179.5 | 200.6 | 224.2 | 250.5 |
| Depreciation, % | 5.77 | 5.59 | 7.16 | 8.25 | 6.51 | 6.66 | 6.66 | 6.66 | 6.66 | 6.66 |
| EBIT | 114.9 | 178.5 | -116.4 | 153.2 | 108.2 | 104.8 | 117.1 | 130.9 | 146.3 | 163.5 |
| EBIT, % | 7.35 | 7.03 | -4.64 | 6.98 | 5.01 | 4.34 | 4.34 | 4.34 | 4.34 | 4.34 |
| Total Cash | 970.2 | 670.8 | 723.6 | 710.7 | 818.6 | 905.2 | 1,011.6 | 1,130.5 | 1,263.4 | 1,411.9 |
| Total Cash, percent | .0 | .0 | .0 | .0 | .0 | .0 | .0 | .0 | .0 | .0 |
| Account Receivables | 647.7 | 855.1 | 764.4 | 723.9 | 670.7 | 818.4 | 914.6 | 1,022.1 | 1,142.3 | 1,276.6 |
| Account Receivables, % | 41.41 | 33.66 | 30.48 | 32.97 | 31.06 | 33.92 | 33.92 | 33.92 | 33.92 | 33.92 |
| Inventories | 418.0 | 364.0 | 416.0 | 305.5 | 396.7 | 434.0 | 485.0 | 542.0 | 605.8 | 677.0 |
| Inventories, % | 26.73 | 14.33 | 16.59 | 13.92 | 18.37 | 17.99 | 17.99 | 17.99 | 17.99 | 17.99 |
| Accounts Payable | 1,008.3 | 812.3 | 897.7 | 637.4 | 762.9 | 948.8 | 1,060.3 | 1,184.9 | 1,324.2 | 1,479.9 |
| Accounts Payable, % | 64.46 | 31.97 | 35.8 | 29.03 | 35.33 | 39.32 | 39.32 | 39.32 | 39.32 | 39.32 |
| Capital Expenditure | -316.2 | -513.0 | -215.9 | -139.8 | -67.7 | -282.4 | -315.6 | -352.7 | -394.2 | -440.5 |
| Capital Expenditure, % | -20.22 | -20.19 | -8.61 | -6.37 | -3.14 | -11.7 | -11.7 | -11.7 | -11.7 | -11.7 |
| Tax Rate, % | 2.42 | 2.42 | 2.42 | 2.42 | 2.42 | 2.42 | 2.42 | 2.42 | 2.42 | 2.42 |
| EBITAT | 113.5 | 190.7 | -96.0 | 160.1 | 105.6 | 100.4 | 112.2 | 125.3 | 140.1 | 156.5 |
| Depreciation | ||||||||||
| Changes in Account Receivables | ||||||||||
| Changes in Inventories | ||||||||||
| Changes in Accounts Payable | ||||||||||
| Capital Expenditure | ||||||||||
| UFCF | -170.0 | -529.6 | -8.2 | 92.0 | 266.0 | -20.6 | -59.7 | -66.7 | -74.5 | -83.3 |
| WACC, % | 7.42 | 7.42 | 7.41 | 7.42 | 7.42 | 7.42 | 7.42 | 7.42 | 7.42 | 7.42 |
| PV UFCF | ||||||||||
| SUM PV UFCF | -239.0 | |||||||||
| Long Term Growth Rate, % | 2.00 | |||||||||
| Free cash flow (T + 1) | -85 | |||||||||
| Terminal Value | -1,569 | |||||||||
| Present Terminal Value | -1,097 | |||||||||
| Enterprise Value | -1,336 | |||||||||
| Net Debt | -688 | |||||||||
| Equity Value | -648 | |||||||||
| Diluted Shares Outstanding, MM | 187 | |||||||||
| Equity Value Per Share | -3.47 |
What You Will Receive
- Customizable Excel Template: A fully adjustable Excel-based DCF Calculator featuring pre-populated financial data for Jiangsu Gian Technology Co., Ltd. (300709SZ).
- Actual Financial Data: Access to historical figures and forward-looking projections (highlighted in the yellow cells).
- Assumption Flexibility: Modify forecast inputs such as revenue growth, EBITDA percentage, and WACC with ease.
- Instant Calculations: Immediately observe the effects of your adjustments on the valuation of Jiangsu Gian Technology Co., Ltd. (300709SZ).
- Professional Grade Tool: Designed for investors, CFOs, consultants, and financial analysts alike.
- User-Friendly Interface: Organized for clarity and simplicity, complete with step-by-step guidance.
Key Features
- Pre-Loaded Data: Historical financial statements and pre-filled forecasts for Jiangsu Gian Technology Co., Ltd. (300709SZ).
- Fully Adjustable Inputs: Customize WACC, tax rates, revenue growth, and EBITDA margins to suit your analysis.
- Instant Results: View the intrinsic value of Jiangsu Gian Technology Co., Ltd. (300709SZ) update in real time.
- Clear Visual Outputs: Dashboard charts present valuation results and key financial metrics in an easy-to-understand format.
- Built for Accuracy: A sophisticated tool designed for analysts, investors, and finance professionals.
How It Works
- Step 1: Download the ready-to-use Excel template containing data for Jiangsu Gian Technology Co., Ltd. (300709SZ).
- Step 2: Review the pre-populated sheets to familiarize yourself with the key performance indicators.
- Step 3: Modify projections and assumptions in the editable yellow cells (WACC, growth rates, profit margins).
- Step 4: Instantly see the updated results, including the intrinsic value of Jiangsu Gian Technology Co., Ltd. (300709SZ).
- Step 5: Use the generated outputs to make well-informed investment choices or create detailed reports.
Why Opt for This Calculator?
- User-Friendly Interface: Tailored to accommodate both novices and seasoned users.
- Customizable Inputs: Quickly adjust parameters to suit your financial analysis.
- Real-Time Updates: Monitor immediate fluctuations in Jiangsu Gian Technology Co., Ltd.’s valuation as you modify inputs.
- Preconfigured Data: Comes with Jiangsu Gian Technology Co., Ltd.’s (300709SZ) actual financial metrics for rapid assessments.
- Preferred by Experts: A tool of choice for investors and analysts seeking to make well-informed choices.
Who Can Benefit from This Product?
- Finance Students: Master valuation techniques and apply them using real-world data.
- Researchers: Integrate industry-standard models into your academic projects or studies.
- Investors: Validate your hypotheses and analyze the valuation results for Jiangsu Gian Technology Co., Ltd. (300709SZ).
- Financial Analysts: Enhance your efficiency with a ready-made, customizable DCF model.
- Entrepreneurs: Discover how large public companies like Jiangsu Gian Technology Co., Ltd. (300709SZ) are evaluated in the market.
What the Template Includes
- Historical Data: Contains Jiangsu Gian Technology’s previous financial performance and fundamental projections.
- DCF and Levered DCF Models: Comprehensive templates for assessing the intrinsic value of Jiangsu Gian Technology.
- WACC Sheet: Pre-configured calculations for Weighted Average Cost of Capital.
- Editable Inputs: Customize essential drivers such as growth rates, EBITDA margins, and CAPEX assumptions.
- Quarterly and Annual Statements: A detailed analysis of Jiangsu Gian Technology’s financial statements.
- Interactive Dashboard: Dynamically visualize valuation results and forecasts.
Disclaimer
All information, articles, and product details provided on this website are for general informational and educational purposes only. We do not claim any ownership over, nor do we intend to infringe upon, any trademarks, copyrights, logos, brand names, or other intellectual property mentioned or depicted on this site. Such intellectual property remains the property of its respective owners, and any references here are made solely for identification or informational purposes, without implying any affiliation, endorsement, or partnership.
We make no representations or warranties, express or implied, regarding the accuracy, completeness, or suitability of any content or products presented. Nothing on this website should be construed as legal, tax, investment, financial, medical, or other professional advice. In addition, no part of this site—including articles or product references—constitutes a solicitation, recommendation, endorsement, advertisement, or offer to buy or sell any securities, franchises, or other financial instruments, particularly in jurisdictions where such activity would be unlawful.
All content is of a general nature and may not address the specific circumstances of any individual or entity. It is not a substitute for professional advice or services. Any actions you take based on the information provided here are strictly at your own risk. You accept full responsibility for any decisions or outcomes arising from your use of this website and agree to release us from any liability in connection with your use of, or reliance upon, the content or products found herein.