
|
GHT Co., Ltd (300711.SZ) Avaliação DCF |
Totalmente Editável: Adapte-Se Às Suas Necessidades No Excel Ou Planilhas
Design Profissional: Modelos Confiáveis E Padrão Da Indústria
Pré-Construídos Para Uso Rápido E Eficiente
Compatível com MAC/PC, totalmente desbloqueado
Não É Necessária Experiência; Fácil De Seguir
GHT Co.,Ltd (300711.SZ) Bundle
Procurando determinar o valor intrínseco da GHT Co., Ltd? Nossa calculadora DCF (300711SZ) integra dados do mundo real com extensos recursos de personalização, permitindo ajustar as previsões e aprimorar suas decisões de investimento.
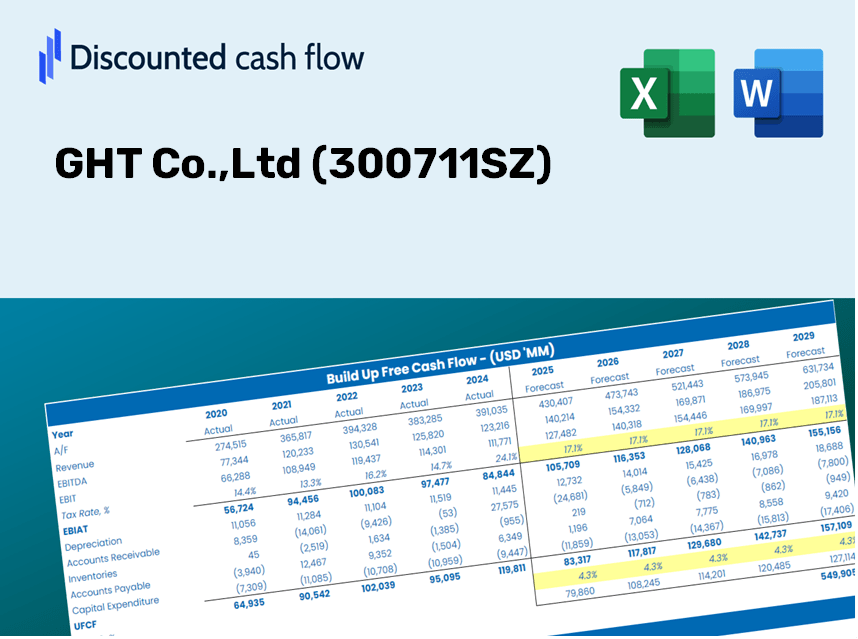
Discounted Cash Flow (DCF) - (USD MM)
| Year | AY1 2020 |
AY2 2021 |
AY3 2022 |
AY4 2023 |
AY5 2024 |
FY1 2025 |
FY2 2026 |
FY3 2027 |
FY4 2028 |
FY5 2029 |
|---|---|---|---|---|---|---|---|---|---|---|
| Revenue | 308.3 | 345.9 | 383.4 | 450.9 | 543.6 | 626.8 | 722.7 | 833.3 | 960.8 | 1,107.7 |
| Revenue Growth, % | 0 | 12.18 | 10.84 | 17.62 | 20.57 | 15.3 | 15.3 | 15.3 | 15.3 | 15.3 |
| EBITDA | 39.8 | 50.8 | 56.0 | 71.2 | 85.4 | 92.4 | 106.5 | 122.8 | 141.6 | 163.2 |
| EBITDA, % | 12.89 | 14.68 | 14.6 | 15.79 | 15.7 | 14.73 | 14.73 | 14.73 | 14.73 | 14.73 |
| Depreciation | 7.3 | 8.6 | 8.6 | 8.5 | 9.3 | 13.4 | 15.4 | 17.8 | 20.5 | 23.6 |
| Depreciation, % | 2.37 | 2.47 | 2.24 | 1.88 | 1.71 | 2.13 | 2.13 | 2.13 | 2.13 | 2.13 |
| EBIT | 32.5 | 42.2 | 47.4 | 62.7 | 76.1 | 79.0 | 91.1 | 105.0 | 121.1 | 139.6 |
| EBIT, % | 10.53 | 12.21 | 12.37 | 13.91 | 13.99 | 12.6 | 12.6 | 12.6 | 12.6 | 12.6 |
| Total Cash | 365.5 | 384.9 | 422.4 | 454.5 | 487.5 | 613.9 | 707.8 | 816.1 | 940.9 | 1,084.9 |
| Total Cash, percent | .0 | .0 | .0 | .0 | .0 | .0 | .0 | .0 | .0 | .0 |
| Account Receivables | 173.8 | 127.6 | 232.4 | 245.6 | 313.2 | 333.4 | 384.4 | 443.2 | 511.1 | 589.3 |
| Account Receivables, % | 56.36 | 36.89 | 60.63 | 54.47 | 57.62 | 53.19 | 53.19 | 53.19 | 53.19 | 53.19 |
| Inventories | 156.4 | 207.6 | 189.5 | 195.9 | 202.3 | 301.9 | 348.1 | 401.4 | 462.8 | 533.6 |
| Inventories, % | 50.72 | 60.04 | 49.43 | 43.44 | 37.21 | 48.17 | 48.17 | 48.17 | 48.17 | 48.17 |
| Accounts Payable | 53.8 | 73.4 | 57.1 | 117.0 | 45.0 | 110.1 | 126.9 | 146.3 | 168.7 | 194.5 |
| Accounts Payable, % | 17.45 | 21.22 | 14.91 | 25.94 | 8.27 | 17.56 | 17.56 | 17.56 | 17.56 | 17.56 |
| Capital Expenditure | -6.7 | -9.1 | -4.1 | -5.1 | -6.2 | -10.2 | -11.8 | -13.6 | -15.6 | -18.0 |
| Capital Expenditure, % | -2.17 | -2.62 | -1.08 | -1.13 | -1.14 | -1.63 | -1.63 | -1.63 | -1.63 | -1.63 |
| Tax Rate, % | 2.88 | 2.88 | 2.88 | 2.88 | 2.88 | 2.88 | 2.88 | 2.88 | 2.88 | 2.88 |
| EBITAT | 31.0 | 43.8 | 48.9 | 61.2 | 73.9 | 77.4 | 89.3 | 102.9 | 118.7 | 136.8 |
| Depreciation | ||||||||||
| Changes in Account Receivables | ||||||||||
| Changes in Inventories | ||||||||||
| Changes in Accounts Payable | ||||||||||
| Capital Expenditure | ||||||||||
| UFCF | -244.8 | 57.8 | -49.6 | 104.9 | -69.0 | 25.9 | 12.6 | 14.5 | 16.7 | 19.3 |
| WACC, % | 4.65 | 4.65 | 4.65 | 4.65 | 4.65 | 4.65 | 4.65 | 4.65 | 4.65 | 4.65 |
| PV UFCF | ||||||||||
| SUM PV UFCF | 78.2 | |||||||||
| Long Term Growth Rate, % | 4.00 | |||||||||
| Free cash flow (T + 1) | 20 | |||||||||
| Terminal Value | 3,084 | |||||||||
| Present Terminal Value | 2,457 | |||||||||
| Enterprise Value | 2,535 | |||||||||
| Net Debt | -488 | |||||||||
| Equity Value | 3,023 | |||||||||
| Diluted Shares Outstanding, MM | 249 | |||||||||
| Equity Value Per Share | 12.13 |
What You Will Receive
- Accurate GHT Financial Data: Loaded with GHT Co., Ltd's historical and projected figures for in-depth analysis.
- Completely Customizable Template: Easily adjust crucial metrics such as revenue growth, WACC, and EBITDA % as needed.
- Instant Calculations: Watch GHT's intrinsic value recalibrate in real-time based on your adjustments.
- Expert Valuation Tool: Tailored for investors, analysts, and consultants who require precise DCF outcomes.
- Intuitive Layout: A straightforward design and clear guidelines suitable for users of all skill levels.
Key Features
- Comprehensive DCF Calculator: Features detailed unlevered and levered DCF valuation models tailored for GHT Co., Ltd (300711SZ).
- WACC Calculator: Comes with a pre-configured Weighted Average Cost of Capital sheet that allows for customizable inputs.
- Modifiable Forecast Assumptions: Easily adjust growth rates, capital expenditures, and discount rates to fit your analysis.
- Integrated Financial Ratios: Evaluate profitability, leverage, and efficiency ratios specifically for GHT Co., Ltd (300711SZ).
- Interactive Dashboard and Charts: Visual representations provide a concise summary of key valuation metrics for straightforward analysis.
How It Works
- Step 1: Download the Excel file for GHT Co., Ltd (300711SZ).
- Step 2: Review the pre-filled financial data and forecasts for GHT Co., Ltd (300711SZ).
- Step 3: Adjust key inputs such as revenue growth, WACC, and tax rates (highlighted cells).
- Step 4: Observe the DCF model updating in real-time as you modify your assumptions.
- Step 5: Evaluate the outputs and utilize the results for your investment strategies.
Why Opt for the GHT Co., Ltd (300711SZ) Calculator?
- Precision: Utilizes real GHT Co., Ltd financial data to ensure accuracy.
- Versatility: Crafted to allow users to experiment and adjust inputs effortlessly.
- Efficiency: Eliminate the need to create a DCF model from the ground up.
- Professional Quality: Built with the expertise and usability expected at the CFO level.
- Intuitive Design: Straightforward to navigate, suitable for those without advanced financial modeling skills.
Who Can Benefit from GHT Co., Ltd [300711SZ]?
- Investors: Evaluate GHT Co., Ltd's valuation to make informed decisions on stock trading.
- CFOs and Financial Analysts: Enhance valuation methodologies and test financial forecasts.
- Startup Founders: Gain insights into how established companies like GHT Co., Ltd are assessed.
- Consultants: Provide comprehensive valuation reports tailored for your clients.
- Students and Educators: Utilize current data to practice and teach effective valuation strategies.
Contents of the Template
- Operating and Balance Sheet Data: Pre-filled historical data and forecasts for GHT Co., Ltd (300711SZ), including revenue, EBITDA, EBIT, and capital expenditures.
- WACC Calculation: A dedicated sheet for Weighted Average Cost of Capital (WACC) featuring key parameters such as Beta, risk-free rate, and share price.
- DCF Valuation (Unlevered and Levered): Customizable Discounted Cash Flow models that present intrinsic value with comprehensive calculations.
- Financial Statements: Pre-loaded annual and quarterly financial statements to aid in analysis.
- Key Ratios: Contains profitability, leverage, and efficiency ratios relevant to GHT Co., Ltd (300711SZ).
- Dashboard and Charts: A visual overview of valuation outputs and underlying assumptions for straightforward analysis of results.
Disclaimer
All information, articles, and product details provided on this website are for general informational and educational purposes only. We do not claim any ownership over, nor do we intend to infringe upon, any trademarks, copyrights, logos, brand names, or other intellectual property mentioned or depicted on this site. Such intellectual property remains the property of its respective owners, and any references here are made solely for identification or informational purposes, without implying any affiliation, endorsement, or partnership.
We make no representations or warranties, express or implied, regarding the accuracy, completeness, or suitability of any content or products presented. Nothing on this website should be construed as legal, tax, investment, financial, medical, or other professional advice. In addition, no part of this site—including articles or product references—constitutes a solicitation, recommendation, endorsement, advertisement, or offer to buy or sell any securities, franchises, or other financial instruments, particularly in jurisdictions where such activity would be unlawful.
All content is of a general nature and may not address the specific circumstances of any individual or entity. It is not a substitute for professional advice or services. Any actions you take based on the information provided here are strictly at your own risk. You accept full responsibility for any decisions or outcomes arising from your use of this website and agree to release us from any liability in connection with your use of, or reliance upon, the content or products found herein.