
|
Zhejiang Changsheng Sliding Bearings Co., Ltd. (300718.sz) Avaliação DCF |
Totalmente Editável: Adapte-Se Às Suas Necessidades No Excel Ou Planilhas
Design Profissional: Modelos Confiáveis E Padrão Da Indústria
Pré-Construídos Para Uso Rápido E Eficiente
Compatível com MAC/PC, totalmente desbloqueado
Não É Necessária Experiência; Fácil De Seguir
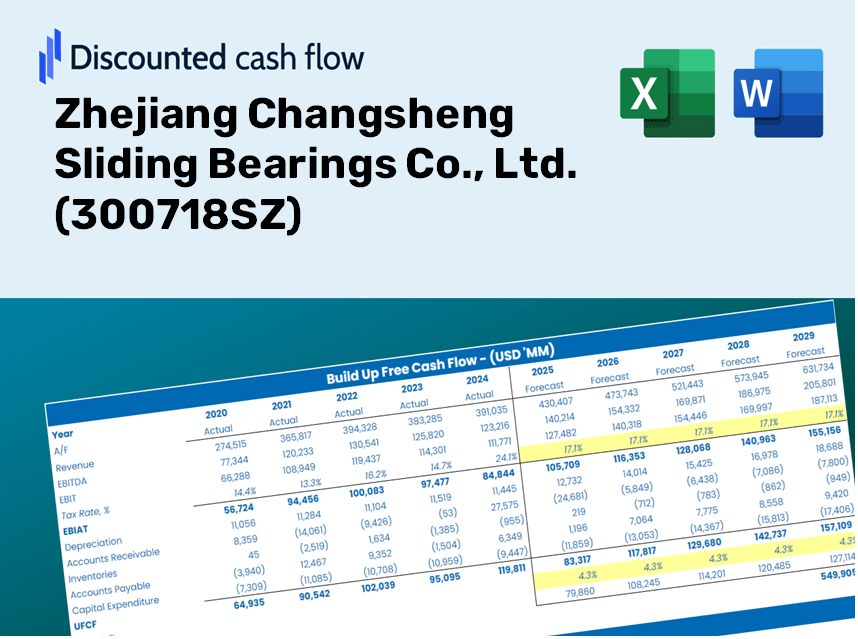
Zhejiang Changsheng Sliding Bearings Co., Ltd. (300718.SZ) Bundle
Explore o futuro financeiro de Zhejiang Changsheng Sliding Bearings Co., Ltd. (300718SZ) com nossa calculadora DCF! Digite suas projeções de crescimento, margens e despesas para calcular o valor intrínseco de Zhejiang Changsheng Sliding Bearings Co., Ltd. (300718SZ) e refine sua estratégia de investimento.
Discounted Cash Flow (DCF) - (USD MM)
| Year | AY1 2020 |
AY2 2021 |
AY3 2022 |
AY4 2023 |
AY5 2024 |
FY1 2025 |
FY2 2026 |
FY3 2027 |
FY4 2028 |
FY5 2029 |
|---|---|---|---|---|---|---|---|---|---|---|
| Revenue | 655.2 | 985.0 | 1,071.4 | 1,105.5 | 1,137.5 | 1,322.8 | 1,538.3 | 1,788.9 | 2,080.3 | 2,419.3 |
| Revenue Growth, % | 0 | 50.32 | 8.77 | 3.18 | 2.89 | 16.29 | 16.29 | 16.29 | 16.29 | 16.29 |
| EBITDA | 176.7 | 195.3 | 232.5 | 314.2 | 311.2 | 328.8 | 382.3 | 444.6 | 517.0 | 601.3 |
| EBITDA, % | 26.96 | 19.83 | 21.7 | 28.42 | 27.36 | 24.85 | 24.85 | 24.85 | 24.85 | 24.85 |
| Depreciation | 44.8 | 51.4 | 58.3 | 63.9 | 65.2 | 76.7 | 89.2 | 103.7 | 120.6 | 140.3 |
| Depreciation, % | 6.83 | 5.22 | 5.44 | 5.78 | 5.73 | 5.8 | 5.8 | 5.8 | 5.8 | 5.8 |
| EBIT | 131.9 | 143.9 | 174.2 | 250.3 | 246.0 | 252.0 | 293.1 | 340.9 | 396.4 | 461.0 |
| EBIT, % | 20.13 | 14.61 | 16.26 | 22.64 | 21.63 | 19.05 | 19.05 | 19.05 | 19.05 | 19.05 |
| Total Cash | 637.6 | 605.6 | 535.4 | 772.4 | 484.5 | 849.8 | 988.3 | 1,149.3 | 1,336.5 | 1,554.3 |
| Total Cash, percent | .0 | .0 | .0 | .0 | .0 | .0 | .0 | .0 | .0 | .0 |
| Account Receivables | 221.1 | 263.7 | 295.4 | 331.3 | 370.9 | 398.6 | 463.5 | 539.0 | 626.9 | 729.0 |
| Account Receivables, % | 33.74 | 26.77 | 27.57 | 29.97 | 32.61 | 30.13 | 30.13 | 30.13 | 30.13 | 30.13 |
| Inventories | 96.5 | 181.7 | 210.1 | 199.6 | 204.1 | 234.9 | 273.1 | 317.6 | 369.4 | 429.6 |
| Inventories, % | 14.73 | 18.44 | 19.61 | 18.06 | 17.94 | 17.76 | 17.76 | 17.76 | 17.76 | 17.76 |
| Accounts Payable | 88.0 | 110.0 | 81.1 | 105.3 | 105.1 | 134.7 | 156.7 | 182.2 | 211.9 | 246.4 |
| Accounts Payable, % | 13.42 | 11.17 | 7.57 | 9.52 | 9.24 | 10.18 | 10.18 | 10.18 | 10.18 | 10.18 |
| Capital Expenditure | -104.7 | -79.1 | -82.3 | -84.3 | -48.5 | -115.3 | -134.1 | -155.9 | -181.3 | -210.9 |
| Capital Expenditure, % | -15.98 | -8.03 | -7.68 | -7.63 | -4.26 | -8.72 | -8.72 | -8.72 | -8.72 | -8.72 |
| Tax Rate, % | 16.53 | 16.53 | 16.53 | 16.53 | 16.53 | 16.53 | 16.53 | 16.53 | 16.53 | 16.53 |
| EBITAT | 113.1 | 125.0 | 157.0 | 215.0 | 205.3 | 217.9 | 253.3 | 294.6 | 342.6 | 398.4 |
| Depreciation | ||||||||||
| Changes in Account Receivables | ||||||||||
| Changes in Inventories | ||||||||||
| Changes in Accounts Payable | ||||||||||
| Capital Expenditure | ||||||||||
| UFCF | -176.5 | -8.4 | 44.1 | 193.3 | 177.8 | 150.5 | 127.2 | 148.0 | 172.1 | 200.1 |
| WACC, % | 4.65 | 4.65 | 4.65 | 4.65 | 4.65 | 4.65 | 4.65 | 4.65 | 4.65 | 4.65 |
| PV UFCF | ||||||||||
| SUM PV UFCF | 692.0 | |||||||||
| Long Term Growth Rate, % | 3.50 | |||||||||
| Free cash flow (T + 1) | 207 | |||||||||
| Terminal Value | 18,074 | |||||||||
| Present Terminal Value | 14,403 | |||||||||
| Enterprise Value | 15,095 | |||||||||
| Net Debt | -122 | |||||||||
| Equity Value | 15,217 | |||||||||
| Diluted Shares Outstanding, MM | 298 | |||||||||
| Equity Value Per Share | 51.15 |
What You Will Receive
- Authentic Zhejiang Changsheng Data: Preloaded financials – from revenue to EBIT – derived from actual and forecasted information.
- Complete Customization: Modify all essential parameters (yellow cells) such as WACC, growth %, and tax rates.
- Immediate Valuation Updates: Automatic recalculations to evaluate how changes affect the fair value of Zhejiang Changsheng Sliding Bearings Co., Ltd. (300718SZ).
- Flexible Excel Template: Designed for quick modifications, scenario analysis, and comprehensive projections.
- Efficient and Precise: Bypass the need to build models from the ground up while ensuring accuracy and adaptability.
Key Features
- Comprehensive Financial Data: Gain access to reliable historical data and future forecasts for Zhejiang Changsheng Sliding Bearings Co., Ltd. (300718SZ).
- Tailorable Forecast Assumptions: Modify highlighted cells for key metrics such as WACC, growth rates, and profit margins.
- Automated Calculations: Enjoy real-time updates for DCF, Net Present Value (NPV), and cash flow analyses.
- Insightful Visual Dashboard: Utilize user-friendly charts and summaries to effectively represent your valuation outcomes.
- Designed for All Users: An intuitive interface suitable for investors, CFOs, and consultants alike.
How It Works
- Step 1: Download the prebuilt Excel template featuring data from Zhejiang Changsheng Sliding Bearings Co., Ltd. (300718SZ).
- Step 2: Navigate through the pre-filled sheets to familiarize yourself with the vital metrics.
- Step 3: Adjust forecasts and assumptions in the editable yellow cells (WACC, growth, margins).
- Step 4: Instantly view the recalculated outcomes, including the intrinsic value of Zhejiang Changsheng Sliding Bearings Co., Ltd. (300718SZ).
- Step 5: Utilize the results to make informed investment choices or create detailed reports.
Reasons to Use Our Calculator for Zhejiang Changsheng Sliding Bearings Co., Ltd. (300718SZ)
- Reliable Data: Utilize up-to-date financial information for accurate valuation outcomes.
- Tailorable: Modify essential factors such as growth forecasts, WACC, and tax rates to align with your analysis.
- Efficiency: Built-in calculations save you the hassle of starting from the ground up.
- Expert-Level Tool: Crafted for investors, analysts, and consultants alike.
- Easy to Navigate: User-friendly design and clear, step-by-step guidance make it accessible for all users.
Who Can Benefit from Our Products?
- Manufacturing Professionals: Develop accurate and robust performance metrics for process improvement.
- Supply Chain Managers: Assess product reliability to enhance procurement strategies.
- Industry Consultants: Deliver precise insights into the bearing market for client advisement.
- Students and Educators: Apply practical examples to learn and teach about manufacturing processes.
- Engineering Enthusiasts: Explore how companies like Zhejiang Changsheng Sliding Bearings Co., Ltd. (300718SZ) innovate within the industry.
Contents of the Template
- In-Depth DCF Model: Fully editable template featuring intricate valuation calculations.
- Market Data: Historical and projected financial data for Zhejiang Changsheng Sliding Bearings Co., Ltd. (300718SZ) preloaded for your analysis.
- Adjustable Parameters: Modify WACC, growth rates, and tax assumptions to evaluate different scenarios.
- Comprehensive Financial Statements: Detailed annual and quarterly breakdowns providing valuable insights.
- Essential Ratios: Integrated analysis tools for assessing profitability, efficiency, and leverage.
- Visual Dashboard: Graphs and tables that present clear, actionable findings.
Disclaimer
All information, articles, and product details provided on this website are for general informational and educational purposes only. We do not claim any ownership over, nor do we intend to infringe upon, any trademarks, copyrights, logos, brand names, or other intellectual property mentioned or depicted on this site. Such intellectual property remains the property of its respective owners, and any references here are made solely for identification or informational purposes, without implying any affiliation, endorsement, or partnership.
We make no representations or warranties, express or implied, regarding the accuracy, completeness, or suitability of any content or products presented. Nothing on this website should be construed as legal, tax, investment, financial, medical, or other professional advice. In addition, no part of this site—including articles or product references—constitutes a solicitation, recommendation, endorsement, advertisement, or offer to buy or sell any securities, franchises, or other financial instruments, particularly in jurisdictions where such activity would be unlawful.
All content is of a general nature and may not address the specific circumstances of any individual or entity. It is not a substitute for professional advice or services. Any actions you take based on the information provided here are strictly at your own risk. You accept full responsibility for any decisions or outcomes arising from your use of this website and agree to release us from any liability in connection with your use of, or reliance upon, the content or products found herein.