
|
Jiangxi Xinyu Guoke Technology Co., Ltd (300722.sz) Avaliação DCF |
Totalmente Editável: Adapte-Se Às Suas Necessidades No Excel Ou Planilhas
Design Profissional: Modelos Confiáveis E Padrão Da Indústria
Pré-Construídos Para Uso Rápido E Eficiente
Compatível com MAC/PC, totalmente desbloqueado
Não É Necessária Experiência; Fácil De Seguir
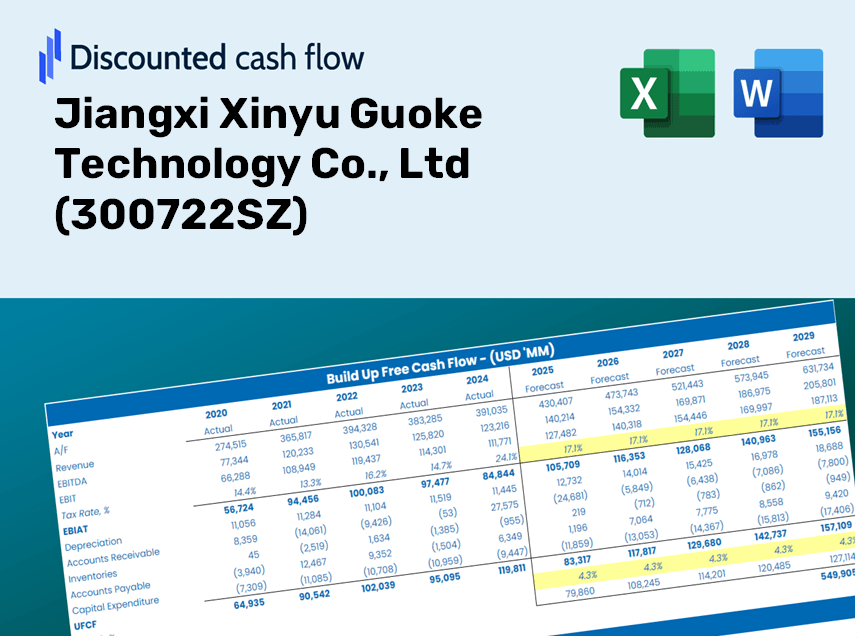
Jiangxi Xinyu Guoke Technology Co., Ltd (300722.SZ) Bundle
Procurando avaliar o valor intrínseco da Jiangxi Xinyu Guoke Technology Co., LTD? Nossa calculadora DCF (300722SZ) integra dados do mundo real com recursos abrangentes de personalização, permitindo refinar suas previsões e aprimorar suas opções de investimento.
Discounted Cash Flow (DCF) - (USD MM)
| Year | AY1 2020 |
AY2 2021 |
AY3 2022 |
AY4 2023 |
AY5 2024 |
FY1 2025 |
FY2 2026 |
FY3 2027 |
FY4 2028 |
FY5 2029 |
|---|---|---|---|---|---|---|---|---|---|---|
| Revenue | 243.5 | 293.3 | 340.7 | 388.6 | 445.1 | 517.6 | 602.0 | 700.1 | 814.2 | 946.9 |
| Revenue Growth, % | 0 | 20.44 | 16.17 | 14.05 | 14.53 | 16.3 | 16.3 | 16.3 | 16.3 | 16.3 |
| EBITDA | 64.9 | 80.9 | 87.1 | 101.1 | 108.3 | 134.7 | 156.7 | 182.2 | 211.9 | 246.5 |
| EBITDA, % | 26.66 | 27.57 | 25.56 | 26.03 | 24.33 | 26.03 | 26.03 | 26.03 | 26.03 | 26.03 |
| Depreciation | 12.6 | 13.6 | 14.3 | 17.9 | 17.4 | 23.3 | 27.1 | 31.5 | 36.7 | 42.6 |
| Depreciation, % | 5.18 | 4.63 | 4.19 | 4.62 | 3.9 | 4.5 | 4.5 | 4.5 | 4.5 | 4.5 |
| EBIT | 52.3 | 67.3 | 72.8 | 83.2 | 90.9 | 111.4 | 129.6 | 150.7 | 175.3 | 203.8 |
| EBIT, % | 21.48 | 22.94 | 21.36 | 21.41 | 20.43 | 21.53 | 21.53 | 21.53 | 21.53 | 21.53 |
| Total Cash | 131.6 | 144.7 | 156.1 | 200.7 | 227.1 | 260.8 | 303.3 | 352.7 | 410.2 | 477.1 |
| Total Cash, percent | .0 | .0 | .0 | .0 | .0 | .0 | .0 | .0 | .0 | .0 |
| Account Receivables | 115.3 | 137.8 | 178.0 | 211.8 | 245.1 | 265.1 | 308.4 | 358.6 | 417.1 | 485.0 |
| Account Receivables, % | 47.35 | 46.97 | 52.23 | 54.49 | 55.06 | 51.22 | 51.22 | 51.22 | 51.22 | 51.22 |
| Inventories | 69.3 | 87.4 | 100.1 | 104.5 | 111.5 | 144.5 | 168.1 | 195.5 | 227.3 | 264.4 |
| Inventories, % | 28.46 | 29.81 | 29.38 | 26.9 | 25.06 | 27.92 | 27.92 | 27.92 | 27.92 | 27.92 |
| Accounts Payable | 23.6 | 21.0 | 20.4 | 38.8 | 66.7 | 49.5 | 57.6 | 67.0 | 77.9 | 90.6 |
| Accounts Payable, % | 9.7 | 7.18 | 6 | 10 | 14.98 | 9.57 | 9.57 | 9.57 | 9.57 | 9.57 |
| Capital Expenditure | -21.0 | -17.7 | -13.1 | -14.7 | -12.8 | -26.0 | -30.3 | -35.2 | -40.9 | -47.6 |
| Capital Expenditure, % | -8.6 | -6.03 | -3.84 | -3.79 | -2.87 | -5.03 | -5.03 | -5.03 | -5.03 | -5.03 |
| Tax Rate, % | 10.61 | 10.61 | 10.61 | 10.61 | 10.61 | 10.61 | 10.61 | 10.61 | 10.61 | 10.61 |
| EBITAT | 46.6 | 60.0 | 65.2 | 74.9 | 81.3 | 99.7 | 115.9 | 134.8 | 156.8 | 182.4 |
| Depreciation | ||||||||||
| Changes in Account Receivables | ||||||||||
| Changes in Inventories | ||||||||||
| Changes in Accounts Payable | ||||||||||
| Capital Expenditure | ||||||||||
| UFCF | -122.7 | 12.7 | 13.0 | 58.3 | 73.4 | 26.8 | 54.1 | 62.9 | 73.2 | 85.1 |
| WACC, % | 4.79 | 4.79 | 4.79 | 4.79 | 4.79 | 4.79 | 4.79 | 4.79 | 4.79 | 4.79 |
| PV UFCF | ||||||||||
| SUM PV UFCF | 257.5 | |||||||||
| Long Term Growth Rate, % | 4.00 | |||||||||
| Free cash flow (T + 1) | 88 | |||||||||
| Terminal Value | 11,242 | |||||||||
| Present Terminal Value | 8,898 | |||||||||
| Enterprise Value | 9,156 | |||||||||
| Net Debt | -227 | |||||||||
| Equity Value | 9,382 | |||||||||
| Diluted Shares Outstanding, MM | 273 | |||||||||
| Equity Value Per Share | 34.36 |
Benefits You Will Experience
- Pre-Filled Financial Model: Utilize actual data from Jiangxi Xinyu Guoke Technology Co., Ltd (300722SZ) for accurate DCF valuation.
- Comprehensive Forecast Control: Modify revenue growth, profit margins, WACC, and other essential parameters.
- Real-Time Calculations: Enjoy automatic updates that reflect results instantly as you make adjustments.
- Professional-Grade Template: A polished Excel framework specifically crafted for high-quality valuation.
- Customizable and Reusable: Designed for adaptability, allowing for repeated application in in-depth forecasting.
Key Features
- Real-Time 300722SZ Data: Pre-loaded with historical financial data and future projections for Jiangxi Xinyu Guoke Technology Co., Ltd.
- Customizable Inputs: Tailor revenue growth, profit margins, WACC, tax rates, and capital expenditures to fit your analysis.
- Adaptive Valuation Model: Automatically recalculates Net Present Value (NPV) and intrinsic value as you modify inputs.
- Scenario Analysis: Develop multiple forecasting scenarios to evaluate various valuation results.
- User-Friendly Interface: Designed for ease of use, catering to both professionals and those new to financial analysis.
How It Operates
- Step 1: Download the preformatted Excel template featuring Jiangxi Xinyu Guoke Technology Co., Ltd's [300722SZ] data.
- Step 2: Examine the pre-filled sheets to familiarize yourself with the essential metrics.
- Step 3: Modify forecasts and assumptions in the editable yellow cells (WACC, growth, margins).
- Step 4: Instantly view updated results, which include the intrinsic value of Jiangxi Xinyu Guoke Technology Co., Ltd [300722SZ].
- Step 5: Utilize the outputs to make informed investment decisions or create detailed reports.
Why Choose Jiangxi Xinyu Guoke Technology Co., Ltd (300722SZ)?
- Streamlined Process: Eliminate the hassle of starting from scratch – our solutions are readily available.
- Enhanced Precision: Utilize dependable financial insights and tools to minimize valuation inaccuracies.
- Fully Adaptable: Customize our framework to align with your specific assumptions and future forecasts.
- User-Friendly Design: Intuitive charts and outputs facilitate straightforward result analysis.
- Preferred by Industry Leaders: Crafted for professionals who demand both accuracy and functionality.
Who Should Use This Product?
- Investors: Evaluate the valuation of Jiangxi Xinyu Guoke Technology Co., Ltd (300722SZ) before making investment decisions.
- CFOs and Financial Analysts: Enhance valuation procedures and assess financial forecasts.
- Startup Founders: Gain insights into the valuation methodologies of established companies like Jiangxi Xinyu Guoke Technology Co., Ltd (300722SZ).
- Consultants: Create comprehensive valuation reports to provide valuable insights for your clients.
- Students and Educators: Utilize authentic data to practice and teach effective valuation strategies.
What the Template Includes
- Extensive DCF Model: Editable framework featuring thorough valuation computations.
- Current Financial Data: Historical and projected financials for Jiangxi Xinyu Guoke Technology Co., Ltd (300722SZ) preloaded for evaluation.
- Adjustable Parameters: Modify WACC, growth rates, and tax assumptions to explore various scenarios.
- Financial Statements: Comprehensive annual and quarterly analyses for enhanced insights.
- Essential Ratios: Integrated assessments for profitability, efficiency, and leverage metrics.
- Dashboard with Visual Representations: Charts and tables providing clear, actionable insights.
Disclaimer
All information, articles, and product details provided on this website are for general informational and educational purposes only. We do not claim any ownership over, nor do we intend to infringe upon, any trademarks, copyrights, logos, brand names, or other intellectual property mentioned or depicted on this site. Such intellectual property remains the property of its respective owners, and any references here are made solely for identification or informational purposes, without implying any affiliation, endorsement, or partnership.
We make no representations or warranties, express or implied, regarding the accuracy, completeness, or suitability of any content or products presented. Nothing on this website should be construed as legal, tax, investment, financial, medical, or other professional advice. In addition, no part of this site—including articles or product references—constitutes a solicitation, recommendation, endorsement, advertisement, or offer to buy or sell any securities, franchises, or other financial instruments, particularly in jurisdictions where such activity would be unlawful.
All content is of a general nature and may not address the specific circumstances of any individual or entity. It is not a substitute for professional advice or services. Any actions you take based on the information provided here are strictly at your own risk. You accept full responsibility for any decisions or outcomes arising from your use of this website and agree to release us from any liability in connection with your use of, or reliance upon, the content or products found herein.