
|
Merit Interactive Co., Ltd. (300766.sz) Avaliação DCF |
Totalmente Editável: Adapte-Se Às Suas Necessidades No Excel Ou Planilhas
Design Profissional: Modelos Confiáveis E Padrão Da Indústria
Pré-Construídos Para Uso Rápido E Eficiente
Compatível com MAC/PC, totalmente desbloqueado
Não É Necessária Experiência; Fácil De Seguir
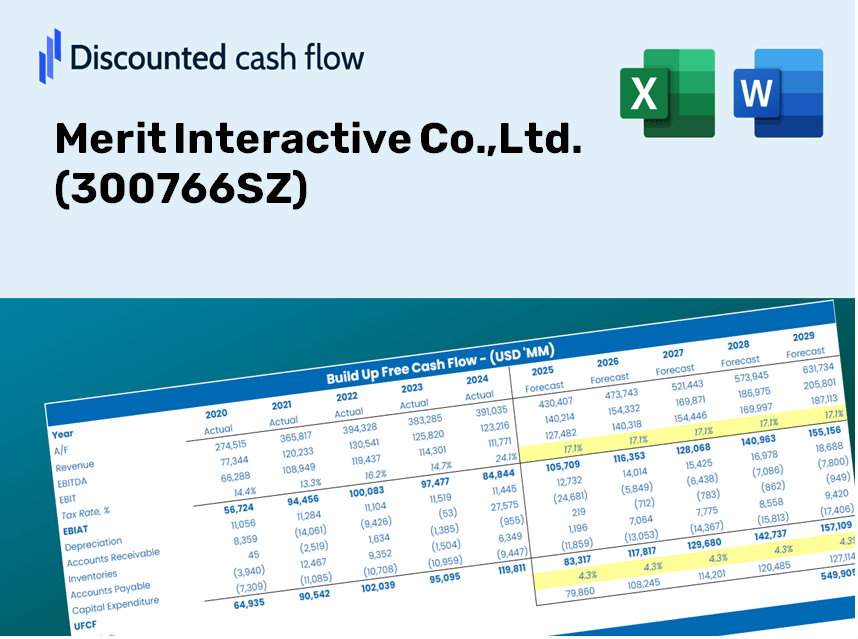
Merit Interactive Co.,Ltd. (300766.SZ) Bundle
Avalie as perspectivas financeiras de mérito Interactive Co., Ltd. Como um especialista! Esta calculadora DCF (300766SZ) fornece dados financeiros pré-preenchidos e flexibilidade para modificar o crescimento da receita, o WACC, as margens de lucro e outras suposições essenciais para se alinhar com suas previsões.
Discounted Cash Flow (DCF) - (USD MM)
| Year | AY1 2020 |
AY2 2021 |
AY3 2022 |
AY4 2023 |
AY5 2024 |
FY1 2025 |
FY2 2026 |
FY3 2027 |
FY4 2028 |
FY5 2029 |
|---|---|---|---|---|---|---|---|---|---|---|
| Revenue | 501.4 | 600.5 | 525.9 | 429.9 | 470.4 | 468.6 | 466.8 | 465.1 | 463.3 | 461.6 |
| Revenue Growth, % | 0 | 19.76 | -12.43 | -18.25 | 9.41 | -0.37735 | -0.37735 | -0.37735 | -0.37735 | -0.37735 |
| EBITDA | 67.8 | 97.8 | 30.9 | -39.0 | 24.0 | 29.7 | 29.6 | 29.5 | 29.4 | 29.3 |
| EBITDA, % | 13.52 | 16.29 | 5.87 | -9.07 | 5.11 | 6.35 | 6.35 | 6.35 | 6.35 | 6.35 |
| Depreciation | 31.2 | 31.8 | 33.6 | 33.8 | 34.7 | 31.1 | 30.9 | 30.8 | 30.7 | 30.6 |
| Depreciation, % | 6.21 | 5.3 | 6.38 | 7.86 | 7.39 | 6.63 | 6.63 | 6.63 | 6.63 | 6.63 |
| EBIT | 36.6 | 66.0 | -2.7 | -72.8 | -10.7 | -1.3 | -1.3 | -1.3 | -1.3 | -1.3 |
| EBIT, % | 7.31 | 10.99 | -0.50943 | -16.92 | -2.27 | -0.28059 | -0.28059 | -0.28059 | -0.28059 | -0.28059 |
| Total Cash | 1,157.9 | 1,104.4 | 1,046.4 | 769.5 | 450.8 | 464.7 | 462.9 | 461.2 | 459.5 | 457.7 |
| Total Cash, percent | .0 | .0 | .0 | .0 | .0 | .0 | .0 | .0 | .0 | .0 |
| Account Receivables | 221.0 | 170.5 | 145.1 | 145.2 | 181.0 | 161.5 | 160.9 | 160.3 | 159.7 | 159.1 |
| Account Receivables, % | 44.07 | 28.38 | 27.6 | 33.78 | 38.47 | 34.46 | 34.46 | 34.46 | 34.46 | 34.46 |
| Inventories | 6.5 | 8.6 | 5.5 | 6.7 | 16.1 | 8.2 | 8.2 | 8.2 | 8.1 | 8.1 |
| Inventories, % | 1.31 | 1.43 | 1.05 | 1.56 | 3.42 | 1.75 | 1.75 | 1.75 | 1.75 | 1.75 |
| Accounts Payable | 73.3 | 104.3 | 86.1 | 52.6 | 57.8 | 68.3 | 68.0 | 67.8 | 67.5 | 67.3 |
| Accounts Payable, % | 14.61 | 17.37 | 16.37 | 12.23 | 12.28 | 14.57 | 14.57 | 14.57 | 14.57 | 14.57 |
| Capital Expenditure | -111.5 | -141.9 | -180.4 | -150.3 | -126.7 | -133.2 | -132.6 | -132.1 | -131.7 | -131.2 |
| Capital Expenditure, % | -22.24 | -23.64 | -34.3 | -34.97 | -26.93 | -28.42 | -28.42 | -28.42 | -28.42 | -28.42 |
| Tax Rate, % | 16.87 | 16.87 | 16.87 | 16.87 | 16.87 | 16.87 | 16.87 | 16.87 | 16.87 | 16.87 |
| EBITAT | 34.4 | 58.4 | -2.1 | -47.8 | -8.9 | -1.1 | -1.1 | -1.1 | -1.1 | -1.1 |
| Depreciation | ||||||||||
| Changes in Account Receivables | ||||||||||
| Changes in Inventories | ||||||||||
| Changes in Accounts Payable | ||||||||||
| Capital Expenditure | ||||||||||
| UFCF | -200.2 | 27.9 | -138.8 | -199.2 | -140.7 | -65.3 | -102.4 | -102.0 | -101.6 | -101.2 |
| WACC, % | 5.07 | 5.07 | 5.07 | 5.07 | 5.07 | 5.07 | 5.07 | 5.07 | 5.07 | 5.07 |
| PV UFCF | ||||||||||
| SUM PV UFCF | -405.3 | |||||||||
| Long Term Growth Rate, % | 4.00 | |||||||||
| Free cash flow (T + 1) | -105 | |||||||||
| Terminal Value | -9,851 | |||||||||
| Present Terminal Value | -7,694 | |||||||||
| Enterprise Value | -8,099 | |||||||||
| Net Debt | -397 | |||||||||
| Equity Value | -7,702 | |||||||||
| Diluted Shares Outstanding, MM | 381 | |||||||||
| Equity Value Per Share | -20.22 |
What You Will Receive
- Authentic Merit Interactive Financial Data: Pre-filled with historical and projected figures for accurate analysis of [300766SZ].
- Fully Customizable Template: Easily adjust key metrics such as revenue growth, WACC, and EBITDA %.
- Instant Calculations: Observe real-time updates on [300766SZ]’s intrinsic value based on your modifications.
- Professional Valuation Resource: Crafted for investors, analysts, and consultants aiming for precise DCF outcomes.
- User-Friendly Interface: An intuitive layout with straightforward instructions suitable for all skill levels.
Key Features
- Comprehensive Data Access: Merit Interactive Co., Ltd.’s historical financial records and pre-loaded forecasts.
- Customizable Inputs: Tailor WACC, tax rates, revenue growth, and EBITDA margins to fit your analysis.
- Real-Time Valuation: Instantly view Merit Interactive’s intrinsic value as it updates live.
- Intuitive Visualizations: Dashboard graphs present valuation outcomes and essential metrics clearly.
- Designed for Precision: A robust tool aimed at analysts, investors, and finance professionals.
How It Functions
- 1. Access the Template: Download and open the Excel file featuring Merit Interactive Co., Ltd.'s (300766SZ) preloaded data.
- 2. Adjust Assumptions: Modify essential inputs such as growth rates, WACC, and capital expenditures.
- 3. View Results in Real-Time: The DCF model automatically computes intrinsic value and NPV for you.
- 4. Explore Different Scenarios: Evaluate multiple projections to assess varying valuation results.
- 5. Utilize with Assurance: Deliver professional valuation insights to bolster your decision-making process.
Why Choose the Merit Interactive Calculator?
- User-Friendly Experience: Crafted for both novices and seasoned professionals.
- Customizable Parameters: Effortlessly adjust inputs to align with your analysis needs.
- Real-Time Updates: Witness immediate valuation shifts for Merit Interactive (300766SZ) as you modify inputs.
- Pre-Configured: Equipped with Merit Interactive's actual financial data for swift evaluations.
- Relied Upon by Experts: Favored by investors and analysts for making well-informed choices.
Who Can Benefit from Merit Interactive Co., Ltd. (300766SZ)?
- Investors: Assess the intrinsic value of Merit Interactive Co., Ltd. (300766SZ) to make informed investment choices.
- CFOs: Utilize a high-quality DCF model to enhance financial reporting and strategic analysis.
- Consultants: Easily customize the valuation template for client reports related to Merit Interactive Co., Ltd. (300766SZ).
- Entrepreneurs: Acquire knowledge of financial modeling practices utilized by leading companies in the industry.
- Educators: Incorporate it as an educational resource to illustrate various valuation techniques.
Contents of the Template
- Pre-Filled DCF Model: Merit Interactive Co.,Ltd.’s financial data preloaded for immediate utilization.
- WACC Calculator: Comprehensive calculations for Weighted Average Cost of Capital.
- Financial Ratios: Assess Merit Interactive’s profitability, leverage, and operational efficiency.
- Editable Inputs: Modify assumptions such as growth rates, profit margins, and CAPEX to suit your scenarios.
- Financial Statements: Annual and quarterly reports available for in-depth analysis.
- Interactive Dashboard: Effortlessly visualize crucial valuation metrics and outcomes.
Disclaimer
All information, articles, and product details provided on this website are for general informational and educational purposes only. We do not claim any ownership over, nor do we intend to infringe upon, any trademarks, copyrights, logos, brand names, or other intellectual property mentioned or depicted on this site. Such intellectual property remains the property of its respective owners, and any references here are made solely for identification or informational purposes, without implying any affiliation, endorsement, or partnership.
We make no representations or warranties, express or implied, regarding the accuracy, completeness, or suitability of any content or products presented. Nothing on this website should be construed as legal, tax, investment, financial, medical, or other professional advice. In addition, no part of this site—including articles or product references—constitutes a solicitation, recommendation, endorsement, advertisement, or offer to buy or sell any securities, franchises, or other financial instruments, particularly in jurisdictions where such activity would be unlawful.
All content is of a general nature and may not address the specific circumstances of any individual or entity. It is not a substitute for professional advice or services. Any actions you take based on the information provided here are strictly at your own risk. You accept full responsibility for any decisions or outcomes arising from your use of this website and agree to release us from any liability in connection with your use of, or reliance upon, the content or products found herein.