
|
Pequim Zhidemai Technology Co., Ltd. (300785.sz) Avaliação DCF |
Totalmente Editável: Adapte-Se Às Suas Necessidades No Excel Ou Planilhas
Design Profissional: Modelos Confiáveis E Padrão Da Indústria
Pré-Construídos Para Uso Rápido E Eficiente
Compatível com MAC/PC, totalmente desbloqueado
Não É Necessária Experiência; Fácil De Seguir
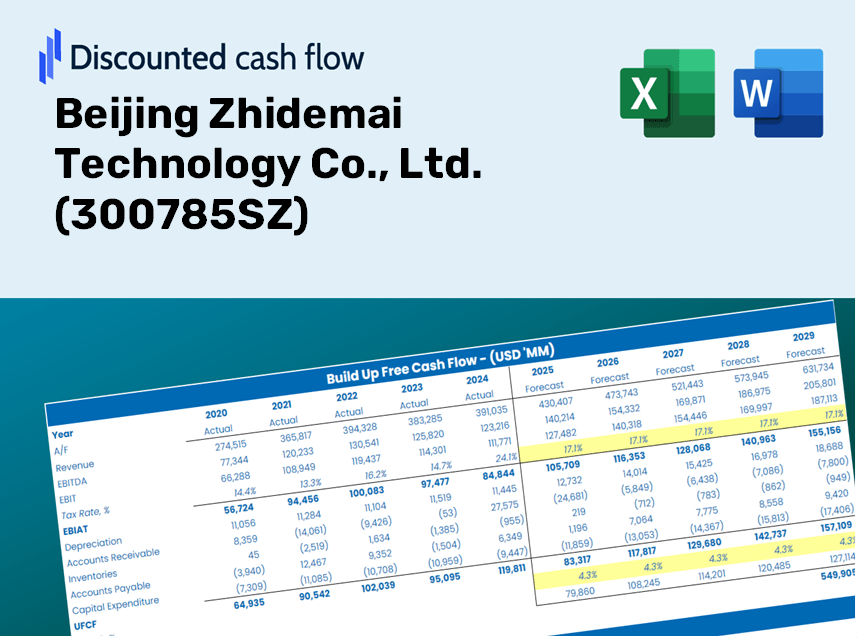
Beijing Zhidemai Technology Co., Ltd. (300785.SZ) Bundle
Simplifique a avaliação de Beijing Zhidemai Technology Co., Ltd. (300785SZ) com esta calculadora DCF personalizável! Apresentando a Beijing Zhidemai Technology Co., Ltd. (300785SZ) e entradas de previsão ajustáveis, você pode testar cenários e descobrir o valor justo de Beijing Zhidemai Technology Co., Ltd. (300785SZ) em minutos.
What You Will Receive
- Adjustable Forecast Inputs: Easily modify assumptions (growth %, profit margins, WACC) to generate various scenarios.
- Comprehensive Data: Beijing Zhidemai Technology Co., Ltd.'s (300785SZ) financial data pre-loaded to expedite your analysis.
- Automated DCF Calculations: The template provides calculations for Net Present Value (NPV) and intrinsic value automatically.
- Professional and Customizable: A refined Excel model tailored to meet your valuation requirements.
- Designed for Analysts and Investors: Perfect for assessing projections, validating strategies, and enhancing efficiency.
Key Features
- Pre-Loaded Data: Historical financial statements and pre-filled forecasts for Beijing Zhidemai Technology Co., Ltd. (300785SZ).
- Fully Customizable Inputs: Modify WACC, tax rates, revenue growth, and EBITDA margins as needed.
- Real-Time Results: Instantly view the recalculated intrinsic value for Beijing Zhidemai Technology Co., Ltd. (300785SZ).
- Dynamic Visual Outputs: Dashboard charts showcase valuation results and critical metrics.
- Designed for Precision: A professional-grade tool tailored for analysts, investors, and finance professionals.
How It Operates
- Download the Template: Gain immediate access to the Excel-based Beijing Zhidemai Technology DCF Calculator.
- Input Your Assumptions: Modify the yellow-highlighted cells for growth rates, WACC, margins, and other key parameters.
- Instant Calculations: The model automatically recalculates the intrinsic value of Beijing Zhidemai Technology Co., Ltd. ([300785SZ]).
- Test Scenarios: Experiment with various assumptions to assess potential changes in valuation.
- Analyze and Decide: Utilize the outcomes to inform your investment or financial evaluations.
Why Opt for Our Calculator?
- Precision: Real financial data from Beijing Zhidemai Technology Co., Ltd. ensures reliable results.
- Adaptability: Crafted to allow users to intuitively modify and experiment with inputs.
- Efficiency: Bypass the complexities of creating a discounted cash flow model from the ground up.
- Expert-Quality: Engineered with the expertise and usability expectations of CFOs in mind.
- Accessible: Designed for ease of use, catering even to individuals with minimal financial modeling skills.
Who Can Benefit from This Product?
- Institutional Investors: Develop comprehensive and accurate valuation frameworks for portfolio management.
- Corporate Finance Departments: Evaluate valuation scenarios to inform strategic decisions.
- Financial Consultants and Advisors: Deliver precise valuation analyses for Beijing Zhidemai Technology Co., Ltd. (300785SZ) to clients.
- Students and Instructors: Utilize real market data for practical learning and teaching in financial modeling.
- Technology Aficionados: Gain insights into the valuation processes of tech firms like Beijing Zhidemai Technology Co., Ltd. (300785SZ).
Contents of the Template
- Pre-Filled DCF Model: Financial data for Beijing Zhidemai Technology Co., Ltd. (300785SZ) preloaded for immediate application.
- WACC Calculator: Comprehensive calculations for the Weighted Average Cost of Capital.
- Financial Ratios: Assess Beijing Zhidemai Technology's profitability, leverage, and operational efficiency.
- Editable Inputs: Modify assumptions such as growth rates, margins, and capital expenditures to suit your scenarios.
- Financial Statements: Annual and quarterly reports provided to facilitate in-depth analysis.
- Interactive Dashboard: Effortlessly visualize key valuation metrics and outcomes.
Disclaimer
All information, articles, and product details provided on this website are for general informational and educational purposes only. We do not claim any ownership over, nor do we intend to infringe upon, any trademarks, copyrights, logos, brand names, or other intellectual property mentioned or depicted on this site. Such intellectual property remains the property of its respective owners, and any references here are made solely for identification or informational purposes, without implying any affiliation, endorsement, or partnership.
We make no representations or warranties, express or implied, regarding the accuracy, completeness, or suitability of any content or products presented. Nothing on this website should be construed as legal, tax, investment, financial, medical, or other professional advice. In addition, no part of this site—including articles or product references—constitutes a solicitation, recommendation, endorsement, advertisement, or offer to buy or sell any securities, franchises, or other financial instruments, particularly in jurisdictions where such activity would be unlawful.
All content is of a general nature and may not address the specific circumstances of any individual or entity. It is not a substitute for professional advice or services. Any actions you take based on the information provided here are strictly at your own risk. You accept full responsibility for any decisions or outcomes arising from your use of this website and agree to release us from any liability in connection with your use of, or reliance upon, the content or products found herein.