
|
Citic Press Corporation (300788.sz) Avaliação DCF |
Totalmente Editável: Adapte-Se Às Suas Necessidades No Excel Ou Planilhas
Design Profissional: Modelos Confiáveis E Padrão Da Indústria
Pré-Construídos Para Uso Rápido E Eficiente
Compatível com MAC/PC, totalmente desbloqueado
Não É Necessária Experiência; Fácil De Seguir
Citic Press Corporation (300788.SZ) Bundle
Simplifique sua análise e aumente a precisão com a nossa calculadora DCF (300788SZ)! Equipado com dados autênticos da Citic Press Corporation e suposições personalizáveis, essa ferramenta permite que você preveja, analise e valorize a Citic Press Corporation, como um investidor experiente.
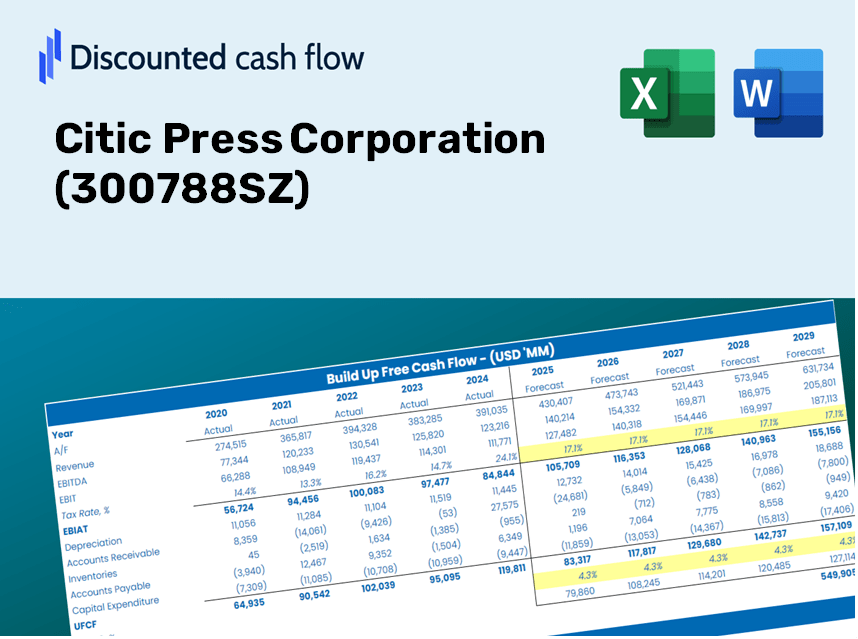
Discounted Cash Flow (DCF) - (USD MM)
| Year | AY1 2020 |
AY2 2021 |
AY3 2022 |
AY4 2023 |
AY5 2024 |
FY1 2025 |
FY2 2026 |
FY3 2027 |
FY4 2028 |
FY5 2029 |
|---|---|---|---|---|---|---|---|---|---|---|
| Revenue | 1,891.8 | 1,922.1 | 1,800.7 | 1,717.0 | 1,687.5 | 1,640.7 | 1,595.3 | 1,551.1 | 1,508.1 | 1,466.4 |
| Revenue Growth, % | 0 | 1.6 | -6.31 | -4.65 | -1.72 | -2.77 | -2.77 | -2.77 | -2.77 | -2.77 |
| EBITDA | 245.5 | 212.1 | 130.5 | 180.0 | 232.6 | 182.2 | 177.2 | 172.3 | 167.5 | 162.9 |
| EBITDA, % | 12.98 | 11.04 | 7.25 | 10.49 | 13.79 | 11.11 | 11.11 | 11.11 | 11.11 | 11.11 |
| Depreciation | 9.6 | 10.5 | 11.2 | 74.5 | 64.7 | 32.3 | 31.4 | 30.5 | 29.7 | 28.9 |
| Depreciation, % | 0.50829 | 0.54395 | 0.6227 | 4.34 | 3.83 | 1.97 | 1.97 | 1.97 | 1.97 | 1.97 |
| EBIT | 235.9 | 201.7 | 119.3 | 105.5 | 168.0 | 149.9 | 145.8 | 141.7 | 137.8 | 134.0 |
| EBIT, % | 12.47 | 10.49 | 6.62 | 6.14 | 9.95 | 9.14 | 9.14 | 9.14 | 9.14 | 9.14 |
| Total Cash | 1,872.8 | 1,859.5 | 1,737.7 | 1,711.6 | 1,747.0 | 1,614.3 | 1,569.5 | 1,526.1 | 1,483.8 | 1,442.7 |
| Total Cash, percent | .0 | .0 | .0 | .0 | .0 | .0 | .0 | .0 | .0 | .0 |
| Account Receivables | 161.5 | 163.4 | 164.2 | 95.6 | 86.3 | 120.9 | 117.5 | 114.3 | 111.1 | 108.0 |
| Account Receivables, % | 8.54 | 8.5 | 9.12 | 5.57 | 5.12 | 7.37 | 7.37 | 7.37 | 7.37 | 7.37 |
| Inventories | 434.6 | 536.4 | 521.4 | 474.4 | 495.6 | 449.0 | 436.6 | 424.5 | 412.7 | 401.3 |
| Inventories, % | 22.97 | 27.9 | 28.95 | 27.63 | 29.37 | 27.37 | 27.37 | 27.37 | 27.37 | 27.37 |
| Accounts Payable | 700.0 | 573.0 | 716.7 | 692.0 | 273.9 | 535.4 | 520.6 | 506.1 | 492.1 | 478.5 |
| Accounts Payable, % | 37 | 29.81 | 39.8 | 40.31 | 16.23 | 32.63 | 32.63 | 32.63 | 32.63 | 32.63 |
| Capital Expenditure | -17.6 | -33.2 | -26.3 | -35.1 | -30.3 | -26.1 | -25.4 | -24.7 | -24.0 | -23.3 |
| Capital Expenditure, % | -0.92876 | -1.73 | -1.46 | -2.05 | -1.79 | -1.59 | -1.59 | -1.59 | -1.59 | -1.59 |
| Tax Rate, % | 25.67 | 25.67 | 25.67 | 25.67 | 25.67 | 25.67 | 25.67 | 25.67 | 25.67 | 25.67 |
| EBITAT | 231.8 | 203.4 | 137.2 | 157.8 | 124.8 | 141.7 | 137.8 | 134.0 | 130.2 | 126.6 |
| Depreciation | ||||||||||
| Changes in Account Receivables | ||||||||||
| Changes in Inventories | ||||||||||
| Changes in Accounts Payable | ||||||||||
| Capital Expenditure | ||||||||||
| UFCF | 327.9 | -50.1 | 280.1 | 287.9 | -270.7 | 421.4 | 144.8 | 140.8 | 136.9 | 133.1 |
| WACC, % | 7.96 | 7.97 | 7.97 | 7.97 | 7.93 | 7.96 | 7.96 | 7.96 | 7.96 | 7.96 |
| PV UFCF | ||||||||||
| SUM PV UFCF | 817.9 | |||||||||
| Long Term Growth Rate, % | 3.00 | |||||||||
| Free cash flow (T + 1) | 137 | |||||||||
| Terminal Value | 2,765 | |||||||||
| Present Terminal Value | 1,885 | |||||||||
| Enterprise Value | 2,703 | |||||||||
| Net Debt | -1,589 | |||||||||
| Equity Value | 4,292 | |||||||||
| Diluted Shares Outstanding, MM | 191 | |||||||||
| Equity Value Per Share | 22.42 |
What You Will Receive
- Authentic 300788 Financials: Features both historical and projected data for precise valuation.
- Customizable Inputs: Adjust metrics such as WACC, taxation, revenue growth, and capital expenditures.
- Automatic Calculations: Intrinsic value and NPV are computed in real-time.
- Scenario Analysis: Explore various scenarios to assess Citic Press Corporation's future performance.
- User-Friendly and Intuitive Design: Crafted for professionals while remaining accessible to newcomers.
Key Features
- Pre-Loaded Data: Citic Press Corporation’s historical financial statements and pre-filled forecasts.
- Fully Adjustable Inputs: Modify WACC, tax rates, revenue growth, and EBITDA margins as needed.
- Instant Results: View Citic Press Corporation’s intrinsic value recalculating in real time.
- Clear Visual Outputs: Dashboard charts showcase valuation results and essential metrics.
- Built for Accuracy: A professional tool designed for analysts, investors, and finance professionals.
How It Works
- Step 1: Download the Excel file.
- Step 2: Examine the pre-filled data for Citic Press Corporation (300788SZ), including historical trends and future projections.
- Step 3: Modify key assumptions (highlighted in yellow) according to your insights.
- Step 4: Observe the automatic adjustments reflecting Citic Press Corporation's (300788SZ) intrinsic value.
- Step 5: Utilize the results for making informed investment choices or for reporting purposes.
Why Opt for This Calculator from Citic Press Corporation (300788SZ)?
- Time Efficient: Skip the hassle of building a DCF model from scratch – it's ready for immediate use.
- Enhanced Accuracy: Dependable financial data and formulas minimize valuation errors.
- Completely Customizable: Adjust the model to align with your specific assumptions and forecasts.
- User-Friendly: Intuitive charts and outputs simplify the analysis of results.
- Endorsed by Professionals: Crafted for experts who prioritize precision and ease of use.
Who Can Benefit from This Product?
- Financial Analysts: Develop comprehensive and precise valuation models for portfolio assessments related to Citic Press Corporation (300788SZ).
- Corporate Strategy Teams: Evaluate valuation scenarios to inform and shape internal business strategies.
- Consultants and Financial Advisors: Deliver clients accurate valuation analyses for Citic Press Corporation (300788SZ).
- Students and Educators: Apply real market data to enhance learning and practice in financial modeling.
- Market Enthusiasts: Gain insights into the valuation processes of companies like Citic Press Corporation (300788SZ).
Contents of the Template
- Comprehensive DCF Model: An editable template featuring detailed valuation calculations.
- Real-World Data: Citic Press Corporation’s (300788SZ) historical and projected financials preloaded for in-depth analysis.
- Customizable Parameters: Modify WACC, growth rates, and tax assumptions to explore various scenarios.
- Financial Statements: Complete annual and quarterly breakdowns for enhanced insights.
- Key Ratios: Integrated analysis for assessing profitability, efficiency, and leverage.
- Dashboard with Visual Outputs: Charts and tables designed for presenting clear, actionable insights.
Disclaimer
All information, articles, and product details provided on this website are for general informational and educational purposes only. We do not claim any ownership over, nor do we intend to infringe upon, any trademarks, copyrights, logos, brand names, or other intellectual property mentioned or depicted on this site. Such intellectual property remains the property of its respective owners, and any references here are made solely for identification or informational purposes, without implying any affiliation, endorsement, or partnership.
We make no representations or warranties, express or implied, regarding the accuracy, completeness, or suitability of any content or products presented. Nothing on this website should be construed as legal, tax, investment, financial, medical, or other professional advice. In addition, no part of this site—including articles or product references—constitutes a solicitation, recommendation, endorsement, advertisement, or offer to buy or sell any securities, franchises, or other financial instruments, particularly in jurisdictions where such activity would be unlawful.
All content is of a general nature and may not address the specific circumstances of any individual or entity. It is not a substitute for professional advice or services. Any actions you take based on the information provided here are strictly at your own risk. You accept full responsibility for any decisions or outcomes arising from your use of this website and agree to release us from any liability in connection with your use of, or reliance upon, the content or products found herein.