
|
Dongguan Yutong Optical Technology Co., Ltd. (300790.SZ) Avaliação DCF |
Totalmente Editável: Adapte-Se Às Suas Necessidades No Excel Ou Planilhas
Design Profissional: Modelos Confiáveis E Padrão Da Indústria
Pré-Construídos Para Uso Rápido E Eficiente
Compatível com MAC/PC, totalmente desbloqueado
Não É Necessária Experiência; Fácil De Seguir
DongGuan YuTong Optical Technology Co.,Ltd. (300790.SZ) Bundle
Avalie as perspectivas financeiras da Dongguan Yutong Optical Technology Co., Ltd. como um especialista! Esta calculadora DCF (300790SZ) fornece dados financeiros pré-preenchidos e flexibilidade para modificar o crescimento da receita, WACC, margens e outras suposições críticas para se alinhar às suas projeções.
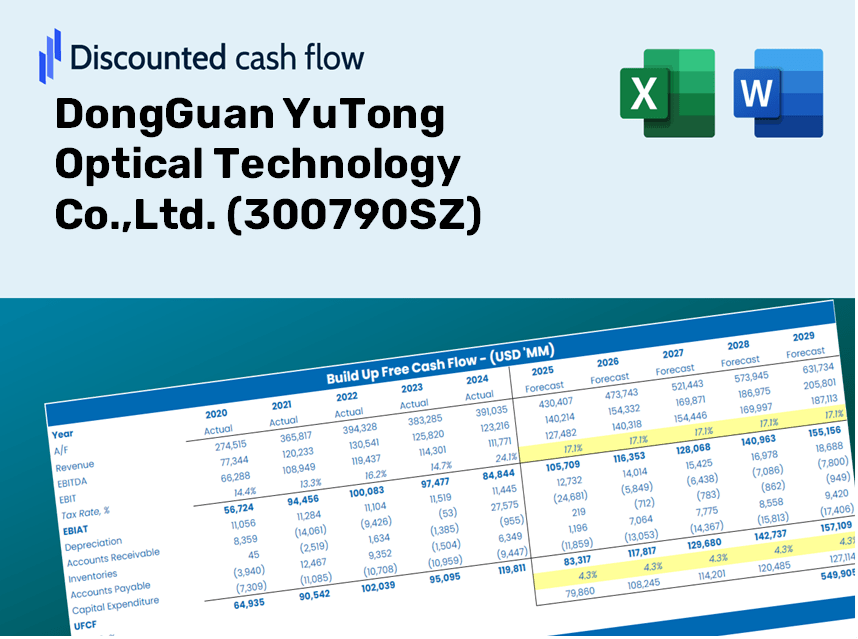
Discounted Cash Flow (DCF) - (USD MM)
| Year | AY1 2020 |
AY2 2021 |
AY3 2022 |
AY4 2023 |
AY5 2024 |
FY1 2025 |
FY2 2026 |
FY3 2027 |
FY4 2028 |
FY5 2029 |
|---|---|---|---|---|---|---|---|---|---|---|
| Revenue | 1,471.5 | 2,061.7 | 1,846.2 | 2,145.0 | 2,743.4 | 3,249.1 | 3,848.1 | 4,557.5 | 5,397.6 | 6,392.7 |
| Revenue Growth, % | 0 | 40.11 | -10.46 | 16.19 | 27.9 | 18.44 | 18.44 | 18.44 | 18.44 | 18.44 |
| EBITDA | 237.2 | 398.5 | 302.6 | 299.1 | 433.8 | 530.2 | 628.0 | 743.8 | 880.9 | 1,043.3 |
| EBITDA, % | 16.12 | 19.33 | 16.39 | 13.95 | 15.81 | 16.32 | 16.32 | 16.32 | 16.32 | 16.32 |
| Depreciation | 76.8 | 113.3 | 156.9 | 194.4 | 212.1 | 234.0 | 277.2 | 328.2 | 388.8 | 460.4 |
| Depreciation, % | 5.22 | 5.49 | 8.5 | 9.06 | 7.73 | 7.2 | 7.2 | 7.2 | 7.2 | 7.2 |
| EBIT | 160.4 | 285.2 | 145.7 | 104.7 | 221.7 | 296.2 | 350.8 | 415.5 | 492.1 | 582.8 |
| EBIT, % | 10.9 | 13.83 | 7.89 | 4.88 | 8.08 | 9.12 | 9.12 | 9.12 | 9.12 | 9.12 |
| Total Cash | 223.7 | 236.7 | 311.5 | 804.8 | 594.8 | 667.7 | 790.8 | 936.6 | 1,109.2 | 1,313.7 |
| Total Cash, percent | .0 | .0 | .0 | .0 | .0 | .0 | .0 | .0 | .0 | .0 |
| Account Receivables | 722.2 | 735.8 | 687.6 | 824.4 | 984.3 | 1,275.8 | 1,511.0 | 1,789.5 | 2,119.4 | 2,510.1 |
| Account Receivables, % | 49.08 | 35.69 | 37.24 | 38.44 | 35.88 | 39.27 | 39.27 | 39.27 | 39.27 | 39.27 |
| Inventories | 370.6 | 668.0 | 720.1 | 600.7 | 580.1 | 947.1 | 1,121.7 | 1,328.5 | 1,573.4 | 1,863.4 |
| Inventories, % | 25.19 | 32.4 | 39.01 | 28 | 21.14 | 29.15 | 29.15 | 29.15 | 29.15 | 29.15 |
| Accounts Payable | 587.3 | 796.2 | 329.6 | 714.0 | 764.8 | 1,023.8 | 1,212.5 | 1,436.1 | 1,700.8 | 2,014.4 |
| Accounts Payable, % | 39.91 | 38.62 | 17.85 | 33.29 | 27.88 | 31.51 | 31.51 | 31.51 | 31.51 | 31.51 |
| Capital Expenditure | -644.8 | -593.5 | -776.9 | -531.6 | -508.4 | -1,026.7 | -1,216.0 | -1,440.2 | -1,705.7 | -2,020.1 |
| Capital Expenditure, % | -43.82 | -28.79 | -42.08 | -24.78 | -18.53 | -31.6 | -31.6 | -31.6 | -31.6 | -31.6 |
| Tax Rate, % | 8.01 | 8.01 | 8.01 | 8.01 | 8.01 | 8.01 | 8.01 | 8.01 | 8.01 | 8.01 |
| EBITAT | 139.3 | 253.6 | 147.4 | 77.4 | 203.9 | 261.7 | 309.9 | 367.1 | 434.8 | 514.9 |
| Depreciation | ||||||||||
| Changes in Account Receivables | ||||||||||
| Changes in Inventories | ||||||||||
| Changes in Accounts Payable | ||||||||||
| Capital Expenditure | ||||||||||
| UFCF | -934.1 | -328.8 | -943.0 | 107.3 | -180.9 | -930.5 | -849.9 | -1,006.6 | -1,192.2 | -1,412.0 |
| WACC, % | 6.02 | 6.04 | 6.1 | 5.95 | 6.06 | 6.03 | 6.03 | 6.03 | 6.03 | 6.03 |
| PV UFCF | ||||||||||
| SUM PV UFCF | -4,474.5 | |||||||||
| Long Term Growth Rate, % | 4.00 | |||||||||
| Free cash flow (T + 1) | -1,468 | |||||||||
| Terminal Value | -72,216 | |||||||||
| Present Terminal Value | -53,879 | |||||||||
| Enterprise Value | -58,353 | |||||||||
| Net Debt | 1,109 | |||||||||
| Equity Value | -59,463 | |||||||||
| Diluted Shares Outstanding, MM | 328 | |||||||||
| Equity Value Per Share | -181.41 |
What You Will Receive
- Accurate DG Optical Financials: Comprises both historical and projected data for precise valuation.
- Customizable Inputs: Adjust WACC, tax rates, revenue growth, and capital expenditures as needed.
- Automated Calculations: Intrinsic value and NPV are computed in real-time.
- Scenario Analysis: Evaluate various scenarios to assess DongGuan YuTong's future performance.
- User-Friendly Design: Crafted for industry professionals while remaining approachable for newcomers.
Key Features
- Pre-Loaded Data: Historical financial statements and pre-filled forecasts for DongGuan YuTong Optical Technology Co., Ltd. (300790SZ).
- Fully Customizable Inputs: Adjust parameters such as WACC, tax rates, revenue growth, and EBITDA margins.
- Real-Time Results: Instantly view the intrinsic value for DongGuan YuTong Optical Technology Co., Ltd. (300790SZ) as it recalculates.
- Engaging Visual Outputs: Dashboard graphics showcase valuation results and essential metrics.
- Designed for Precision: A professional-grade tool tailored for analysts, investors, and finance professionals.
How It Works
- Download: Obtain the user-friendly Excel file containing DongGuan YuTong Optical Technology Co.,Ltd.'s financial data.
- Customize: Tailor projections such as revenue growth, EBITDA %, and WACC to fit your analysis.
- Update Automatically: Watch as the intrinsic value and NPV calculations refresh in real-time.
- Test Scenarios: Generate various forecasts and instantly evaluate the different outcomes.
- Make Decisions: Leverage the valuation insights to inform your investment strategy for DongGuan YuTong Optical Technology Co.,Ltd. (300790SZ).
Why Opt for This Calculator?
- Designed for Experts: A sophisticated tool tailored for analysts, CFOs, and consultants in the optical technology sector.
- Accurate Data: DongGuan YuTong Optical Technology Co.,Ltd.'s (300790SZ) historical and projected financials are preloaded for precision.
- Flexible Scenario Analysis: Effortlessly simulate various forecasts and assumptions.
- Comprehensive Outputs: Automatically computes intrinsic value, NPV, and essential metrics.
- User-Friendly: Step-by-step guidance makes navigating the tool straightforward.
Who Can Benefit from This Product?
- Individual Investors: Gain valuable insights for making informed decisions on buying or selling DongGuan YuTong Optical Technology Co., Ltd. (300790SZ) stock.
- Financial Analysts: Enhance valuation processes with pre-built financial models relevant to DongGuan YuTong Optical Technology Co., Ltd. (300790SZ).
- Consultants: Provide clients with accurate and efficient valuation analysis pertaining to DongGuan YuTong Optical Technology Co., Ltd. (300790SZ).
- Business Owners: Learn how established companies like DongGuan YuTong Optical Technology Co., Ltd. (300790SZ) are valued to inform your own business strategy.
- Finance Students: Explore valuation methodologies using real-life examples and data from DongGuan YuTong Optical Technology Co., Ltd. (300790SZ).
Contents of the Template
- Pre-Filled Data: Contains DongGuan YuTong Optical Technology Co.,Ltd.'s (300790SZ) historical financial performance and projections.
- Discounted Cash Flow Model: An editable DCF valuation model with automatic calculation features.
- Weighted Average Cost of Capital (WACC): A specific worksheet for calculating WACC using customized inputs.
- Key Financial Ratios: Evaluate DongGuan YuTong's (300790SZ) profitability, efficiency, and financial leverage.
- Customizable Inputs: Easily modify parameters such as revenue growth, margins, and tax rates.
- Clear Dashboard: Visual representations and tables that summarize essential valuation results.
Disclaimer
All information, articles, and product details provided on this website are for general informational and educational purposes only. We do not claim any ownership over, nor do we intend to infringe upon, any trademarks, copyrights, logos, brand names, or other intellectual property mentioned or depicted on this site. Such intellectual property remains the property of its respective owners, and any references here are made solely for identification or informational purposes, without implying any affiliation, endorsement, or partnership.
We make no representations or warranties, express or implied, regarding the accuracy, completeness, or suitability of any content or products presented. Nothing on this website should be construed as legal, tax, investment, financial, medical, or other professional advice. In addition, no part of this site—including articles or product references—constitutes a solicitation, recommendation, endorsement, advertisement, or offer to buy or sell any securities, franchises, or other financial instruments, particularly in jurisdictions where such activity would be unlawful.
All content is of a general nature and may not address the specific circumstances of any individual or entity. It is not a substitute for professional advice or services. Any actions you take based on the information provided here are strictly at your own risk. You accept full responsibility for any decisions or outcomes arising from your use of this website and agree to release us from any liability in connection with your use of, or reliance upon, the content or products found herein.