
|
Pequim Compass Technology Development Co., Ltd. (300803.SZ) Avaliação DCF |
Totalmente Editável: Adapte-Se Às Suas Necessidades No Excel Ou Planilhas
Design Profissional: Modelos Confiáveis E Padrão Da Indústria
Pré-Construídos Para Uso Rápido E Eficiente
Compatível com MAC/PC, totalmente desbloqueado
Não É Necessária Experiência; Fácil De Seguir
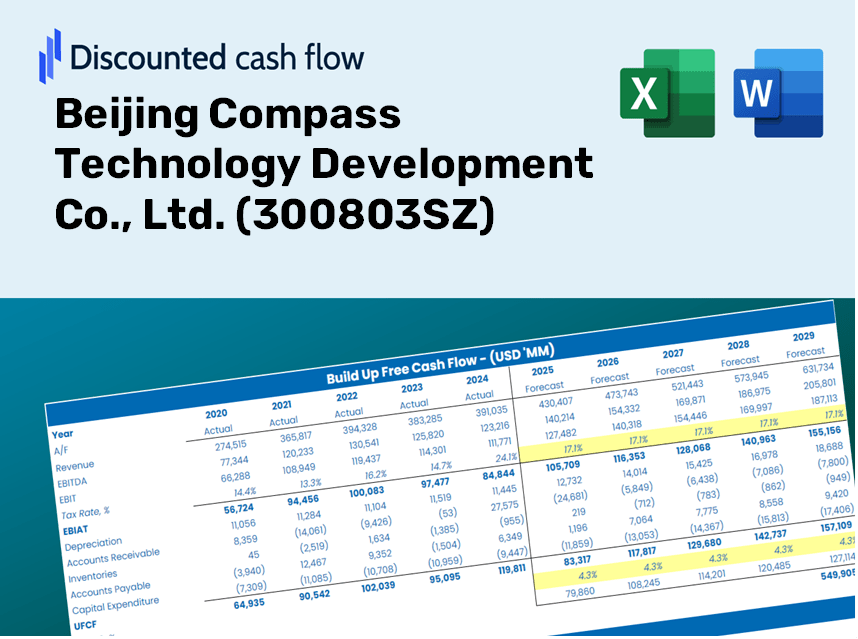
Beijing Compass Technology Development Co., Ltd. (300803.SZ) Bundle
Projetado para precisão, a nossa calculadora DCF (300803SZ) permite avaliar a avaliação da Beijing Compass Technology Development Co., Ltd. usando dados financeiros do mundo real e oferece flexibilidade completa para modificar todos os parâmetros essenciais para projeções aprimoradas.
Discounted Cash Flow (DCF) - (USD MM)
| Year | AY1 2020 |
AY2 2021 |
AY3 2022 |
AY4 2023 |
AY5 2024 |
FY1 2025 |
FY2 2026 |
FY3 2027 |
FY4 2028 |
FY5 2029 |
|---|---|---|---|---|---|---|---|---|---|---|
| Revenue | 692.6 | 932.4 | 1,257.2 | 1,121.8 | 1,540.0 | 1,909.5 | 2,367.6 | 2,935.7 | 3,640.0 | 4,513.3 |
| Revenue Growth, % | 0 | 34.63 | 34.83 | -10.77 | 37.28 | 23.99 | 23.99 | 23.99 | 23.99 | 23.99 |
| EBITDA | 74.6 | 164.4 | 286.8 | 40.3 | 11.5 | 212.1 | 263.0 | 326.2 | 404.4 | 501.4 |
| EBITDA, % | 10.77 | 17.64 | 22.81 | 3.59 | 0.74652 | 11.11 | 11.11 | 11.11 | 11.11 | 11.11 |
| Depreciation | 18.3 | 17.6 | 29.9 | 44.7 | 29.6 | 48.9 | 60.7 | 75.2 | 93.3 | 115.6 |
| Depreciation, % | 2.64 | 1.89 | 2.38 | 3.98 | 1.92 | 2.56 | 2.56 | 2.56 | 2.56 | 2.56 |
| EBIT | 56.3 | 146.8 | 256.9 | -4.4 | -18.1 | 163.2 | 202.4 | 250.9 | 311.2 | 385.8 |
| EBIT, % | 8.13 | 15.75 | 20.43 | -0.38999 | -1.18 | 8.55 | 8.55 | 8.55 | 8.55 | 8.55 |
| Total Cash | 1,229.8 | 1,607.5 | 2,073.8 | 2,954.2 | 7,489.2 | 1,909.5 | 2,367.6 | 2,935.7 | 3,640.0 | 4,513.3 |
| Total Cash, percent | .0 | .0 | .0 | .0 | .0 | .0 | .0 | .0 | .0 | .0 |
| Account Receivables | 11.4 | 75.3 | 120.4 | 107.0 | 318.8 | 189.2 | 234.6 | 290.8 | 360.6 | 447.1 |
| Account Receivables, % | 1.64 | 8.08 | 9.58 | 9.54 | 20.7 | 9.91 | 9.91 | 9.91 | 9.91 | 9.91 |
| Inventories | .3 | 1.0 | 1.1 | .5 | .2 | 1.1 | 1.4 | 1.7 | 2.1 | 2.6 |
| Inventories, % | 0.03933883 | 0.11187 | 0.08708266 | 0.04330679 | 0.01091367 | 0.05850313 | 0.05850313 | 0.05850313 | 0.05850313 | 0.05850313 |
| Accounts Payable | 33.4 | 37.6 | 46.5 | 60.5 | 113.5 | 96.7 | 119.9 | 148.6 | 184.3 | 228.5 |
| Accounts Payable, % | 4.83 | 4.04 | 3.7 | 5.39 | 7.37 | 5.06 | 5.06 | 5.06 | 5.06 | 5.06 |
| Capital Expenditure | -14.4 | -15.3 | -53.4 | -65.4 | -118.0 | -81.9 | -101.6 | -126.0 | -156.2 | -193.7 |
| Capital Expenditure, % | -2.08 | -1.64 | -4.25 | -5.83 | -7.66 | -4.29 | -4.29 | -4.29 | -4.29 | -4.29 |
| Tax Rate, % | -2.93 | -2.93 | -2.93 | -2.93 | -2.93 | -2.93 | -2.93 | -2.93 | -2.93 | -2.93 |
| EBITAT | 54.5 | 136.4 | 316.7 | -5.1 | -18.7 | 159.8 | 198.2 | 245.7 | 304.7 | 377.8 |
| Depreciation | ||||||||||
| Changes in Account Receivables | ||||||||||
| Changes in Inventories | ||||||||||
| Changes in Accounts Payable | ||||||||||
| Capital Expenditure | ||||||||||
| UFCF | 80.1 | 78.2 | 256.8 | 2.3 | -265.6 | 238.7 | 134.8 | 167.1 | 207.2 | 256.9 |
| WACC, % | 8.15 | 8.14 | 8.15 | 8.15 | 8.15 | 8.15 | 8.15 | 8.15 | 8.15 | 8.15 |
| PV UFCF | ||||||||||
| SUM PV UFCF | 793.4 | |||||||||
| Long Term Growth Rate, % | 2.00 | |||||||||
| Free cash flow (T + 1) | 262 | |||||||||
| Terminal Value | 4,265 | |||||||||
| Present Terminal Value | 2,883 | |||||||||
| Enterprise Value | 3,676 | |||||||||
| Net Debt | -5,852 | |||||||||
| Equity Value | 9,528 | |||||||||
| Diluted Shares Outstanding, MM | 413 | |||||||||
| Equity Value Per Share | 23.06 |
Benefits You Will Receive
- Customizable Excel Template: A fully adjustable Excel-based DCF Calculator featuring pre-filled financial data for Beijing Compass Technology Development Co., Ltd. (300803SZ).
- Accurate Data: Access to historical figures and forward-looking projections (highlighted in the yellow cells).
- Flexibility in Forecasting: Modify assumptions regarding revenue growth, EBITDA percentage, and WACC as needed.
- Instant Calculations: Quickly observe how your changes affect the valuation of Beijing Compass Technology Development Co., Ltd. (300803SZ).
- Professional Resource: Designed for investors, CFOs, consultants, and financial analysts alike.
- User-Friendly Interface: Organized for clarity and simplicity, complete with step-by-step guidance.
Key Features
- Customizable Forecast Inputs: Adjust essential variables such as revenue growth, EBITDA margin, and capital expenditures.
- Instant DCF Valuation: Automatically computes intrinsic value, NPV, and other financial metrics with ease.
- Industry-Leading Precision: Leverages Beijing Compass Technology's actual financial data for reliable valuation results.
- Simplified Scenario Analysis: Effortlessly evaluate various assumptions and compare results side by side.
- Efficiency Booster: Remove the hassle of constructing intricate valuation models from the ground up.
How It Works
- Step 1: Download the Excel file.
- Step 2: Review the pre-filled data for Beijing Compass Technology Development Co., Ltd. (300803SZ) (historical and forecasted).
- Step 3: Modify the key assumptions (yellow cells) according to your analysis.
- Step 4: Observe the automatic updates for the intrinsic value of Beijing Compass Technology Development Co., Ltd. (300803SZ).
- Step 5: Utilize the results for investment decisions or reporting purposes.
Why Choose This Calculator for Beijing Compass Technology Development Co., Ltd. (300803SZ)?
- Precise Information: Utilize actual financial data from Beijing Compass to ensure trustworthy valuation outcomes.
- Tailorable: Modify essential variables such as growth rates, WACC, and tax rates to align with your forecasts.
- Efficient: Built-in calculations save you the hassle of starting from the ground up.
- High-Quality Tool: Crafted for investors, analysts, and consultants looking to make informed decisions.
- User-Friendly: An intuitive design and straightforward guidance make it accessible for all users.
Who Can Benefit from This Product?
- Finance Students: Master valuation methods and put them into practice with real-world data.
- Academics: Integrate professional financial models into your teaching or research initiatives.
- Investors: Validate your hypotheses and evaluate valuation results for Beijing Compass Technology Development Co., Ltd. (300803SZ).
- Financial Analysts: Enhance your efficiency with a ready-to-use, customizable DCF model.
- Small Business Owners: Discover how major public companies like Beijing Compass Technology Development Co., Ltd. (300803SZ) are evaluated.
Contents of the Template
- Pre-Filled DCF Model: Beijing Compass Technology's financial data preloaded for immediate analysis.
- WACC Calculator: Comprehensive calculations for the Weighted Average Cost of Capital.
- Financial Ratios: Assess Beijing Compass Technology's profitability, leverage, and operational efficiency.
- Editable Inputs: Modify assumptions such as growth rates, profit margins, and CAPEX to suit your scenarios.
- Financial Statements: Access annual and quarterly reports to facilitate in-depth analysis.
- Interactive Dashboard: Effortlessly visualize essential valuation metrics and outcomes.
Disclaimer
All information, articles, and product details provided on this website are for general informational and educational purposes only. We do not claim any ownership over, nor do we intend to infringe upon, any trademarks, copyrights, logos, brand names, or other intellectual property mentioned or depicted on this site. Such intellectual property remains the property of its respective owners, and any references here are made solely for identification or informational purposes, without implying any affiliation, endorsement, or partnership.
We make no representations or warranties, express or implied, regarding the accuracy, completeness, or suitability of any content or products presented. Nothing on this website should be construed as legal, tax, investment, financial, medical, or other professional advice. In addition, no part of this site—including articles or product references—constitutes a solicitation, recommendation, endorsement, advertisement, or offer to buy or sell any securities, franchises, or other financial instruments, particularly in jurisdictions where such activity would be unlawful.
All content is of a general nature and may not address the specific circumstances of any individual or entity. It is not a substitute for professional advice or services. Any actions you take based on the information provided here are strictly at your own risk. You accept full responsibility for any decisions or outcomes arising from your use of this website and agree to release us from any liability in connection with your use of, or reliance upon, the content or products found herein.