
|
Hiecise Precision Equipment Co., Ltd. (300809.SZ) Avaliação DCF |
Totalmente Editável: Adapte-Se Às Suas Necessidades No Excel Ou Planilhas
Design Profissional: Modelos Confiáveis E Padrão Da Indústria
Pré-Construídos Para Uso Rápido E Eficiente
Compatível com MAC/PC, totalmente desbloqueado
Não É Necessária Experiência; Fácil De Seguir
Hiecise Precision Equipment Co.,Ltd. (300809.SZ) Bundle
Avalie as perspectivas financeiras da Hiecise Precision Equipment Co., Ltd. como um especialista! Esta calculadora DCF (300809SZ) fornece dados financeiros pré-preenchidos e flexibilidade total para modificar o crescimento da receita, o WACC, as margens e outras suposições cruciais para se alinhar às suas previsões.
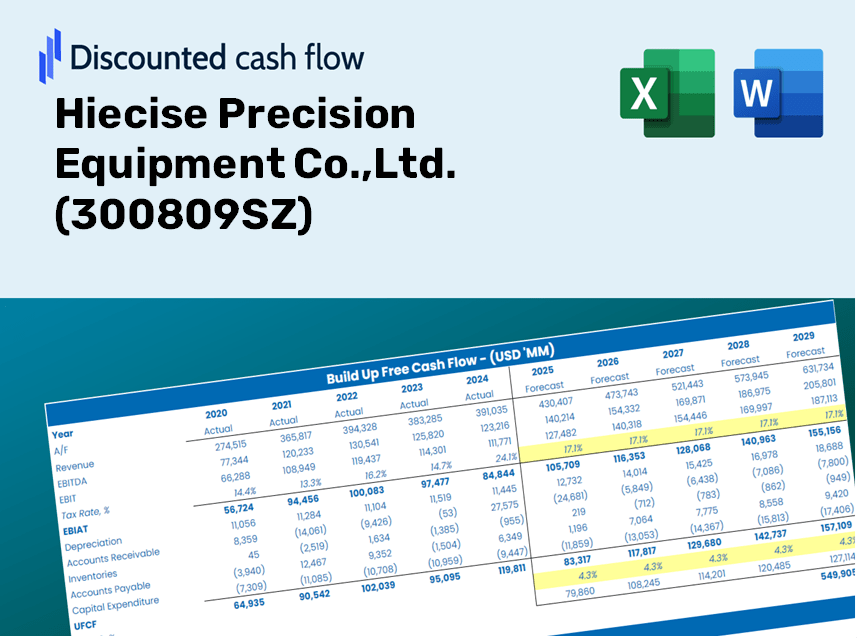
Discounted Cash Flow (DCF) - (USD MM)
| Year | AY1 2020 |
AY2 2021 |
AY3 2022 |
AY4 2023 |
AY5 2024 |
FY1 2025 |
FY2 2026 |
FY3 2027 |
FY4 2028 |
FY5 2029 |
|---|---|---|---|---|---|---|---|---|---|---|
| Revenue | 230.6 | 409.5 | 336.3 | 479.2 | 446.0 | 552.2 | 683.6 | 846.3 | 1,047.8 | 1,297.2 |
| Revenue Growth, % | 0 | 77.53 | -17.86 | 42.48 | -6.92 | 23.8 | 23.8 | 23.8 | 23.8 | 23.8 |
| EBITDA | 39.4 | 82.6 | 28.7 | 134.5 | 50.3 | 94.0 | 116.4 | 144.1 | 178.4 | 220.8 |
| EBITDA, % | 17.08 | 20.18 | 8.52 | 28.06 | 11.28 | 17.02 | 17.02 | 17.02 | 17.02 | 17.02 |
| Depreciation | 17.5 | 26.4 | 27.5 | 27.5 | 38.4 | 40.4 | 50.0 | 61.9 | 76.6 | 94.9 |
| Depreciation, % | 7.61 | 6.45 | 8.17 | 5.73 | 8.62 | 7.31 | 7.31 | 7.31 | 7.31 | 7.31 |
| EBIT | 21.8 | 56.2 | 1.2 | 107.0 | 11.8 | 53.6 | 66.4 | 82.2 | 101.7 | 126.0 |
| EBIT, % | 9.47 | 13.73 | 0.35648 | 22.33 | 2.66 | 9.71 | 9.71 | 9.71 | 9.71 | 9.71 |
| Total Cash | 1,102.7 | 1,037.4 | 1,029.1 | 867.7 | 849.9 | 552.2 | 683.6 | 846.3 | 1,047.8 | 1,297.2 |
| Total Cash, percent | .0 | .0 | .0 | .0 | .0 | .0 | .0 | .0 | .0 | .0 |
| Account Receivables | 281.1 | 280.8 | 258.8 | 319.1 | 296.8 | 418.2 | 517.7 | 640.9 | 793.5 | 982.4 |
| Account Receivables, % | 121.89 | 68.57 | 76.95 | 66.6 | 66.54 | 75.73 | 75.73 | 75.73 | 75.73 | 75.73 |
| Inventories | 230.7 | 274.1 | 406.0 | 380.6 | 361.3 | 471.9 | 584.3 | 723.4 | 895.6 | 1,108.8 |
| Inventories, % | 100.02 | 66.93 | 120.73 | 79.43 | 81 | 85.47 | 85.47 | 85.47 | 85.47 | 85.47 |
| Accounts Payable | 103.0 | 134.9 | 190.1 | 153.2 | 59.8 | 198.2 | 245.4 | 303.8 | 376.2 | 465.7 |
| Accounts Payable, % | 44.67 | 32.94 | 56.53 | 31.97 | 13.4 | 35.9 | 35.9 | 35.9 | 35.9 | 35.9 |
| Capital Expenditure | -15.0 | -28.6 | -50.1 | -152.5 | -45.6 | -77.8 | -96.3 | -119.2 | -147.6 | -182.7 |
| Capital Expenditure, % | -6.51 | -6.98 | -14.9 | -31.83 | -10.21 | -14.09 | -14.09 | -14.09 | -14.09 | -14.09 |
| Tax Rate, % | 7.6 | 7.6 | 7.6 | 7.6 | 7.6 | 7.6 | 7.6 | 7.6 | 7.6 | 7.6 |
| EBITAT | 19.4 | 47.6 | 1.0 | 91.2 | 10.9 | 46.7 | 57.9 | 71.6 | 88.7 | 109.8 |
| Depreciation | ||||||||||
| Changes in Account Receivables | ||||||||||
| Changes in Inventories | ||||||||||
| Changes in Accounts Payable | ||||||||||
| Capital Expenditure | ||||||||||
| UFCF | -386.8 | 34.3 | -76.4 | -105.7 | -47.8 | -84.3 | -153.1 | -189.6 | -234.7 | -290.6 |
| WACC, % | 6.33 | 6.33 | 6.33 | 6.33 | 6.33 | 6.33 | 6.33 | 6.33 | 6.33 | 6.33 |
| PV UFCF | ||||||||||
| SUM PV UFCF | -769.8 | |||||||||
| Long Term Growth Rate, % | 4.00 | |||||||||
| Free cash flow (T + 1) | -302 | |||||||||
| Terminal Value | -12,969 | |||||||||
| Present Terminal Value | -9,541 | |||||||||
| Enterprise Value | -10,311 | |||||||||
| Net Debt | -227 | |||||||||
| Equity Value | -10,084 | |||||||||
| Diluted Shares Outstanding, MM | 258 | |||||||||
| Equity Value Per Share | -39.05 |
What You Will Receive
- Adjustable Forecast Inputs: Effortlessly modify assumptions (growth %, margins, WACC) to explore various scenarios.
- Industry-Specific Data: Hiecise Precision Equipment Co., Ltd.'s financial data pre-loaded to facilitate your analysis.
- Automated DCF Results: The model computes Net Present Value (NPV) and intrinsic value instantly.
- Customizable and Professional Design: A sleek Excel model tailored to meet your valuation requirements.
- Designed for Analysts and Investors: Perfect for evaluating projections, confirming strategies, and enhancing efficiency.
Key Features
- 🔍 Real-Life Hiecise Financials: Pre-filled historical and projected data for Hiecise Precision Equipment Co., Ltd. (300809SZ).
- ✏️ Fully Customizable Inputs: Adjust all critical parameters (yellow cells) such as WACC, growth %, and tax rates.
- 📊 Professional DCF Valuation: Integrated formulas calculate Hiecise's intrinsic value using the Discounted Cash Flow method.
- ⚡ Instant Results: View Hiecise's valuation immediately after incorporating changes.
- Scenario Analysis: Examine and contrast outcomes for different financial assumptions side-by-side.
How It Operates
- Step 1: Download the Excel file.
- Step 2: Examine the pre-filled data for Hiecise Precision Equipment Co., Ltd. (300809SZ).
- Step 3: Modify key assumptions (highlighted in yellow) according to your analysis.
- Step 4: Observe real-time recalculations of Hiecise’s intrinsic value.
- Step 5: Utilize the results for investment strategies or reporting purposes.
Why Select Hiecise Precision Equipment Co., Ltd.?
- Engineered for Experts: A sophisticated tool tailored for analysts, CFOs, and industry consultants.
- Accurate Data: Historical and projected financial metrics for Hiecise preloaded to ensure precision.
- Flexible Scenario Analysis: Effortlessly model various forecasts and assumptions.
- Insightful Results: Automatically computes intrinsic value, NPV, and essential financial metrics.
- User-Friendly: Comprehensive step-by-step instructions facilitate a smooth experience.
Who Can Benefit from This Product?
- Investors: Accurately evaluate Hiecise Precision Equipment Co., Ltd.’s (300809SZ) fair value prior to making investment choices.
- CFOs: Utilize a professional-grade DCF model for precise financial reporting and analysis.
- Consultants: Effortlessly customize the template for client valuation reports.
- Entrepreneurs: Acquire insights into the financial modeling practices of leading companies.
- Educators: Employ it as a resource to illustrate valuation techniques in the classroom.
Contents of the Template
- Pre-Filled Data: Contains historical financial data and forecasts for Hiecise Precision Equipment Co., Ltd. (300809SZ).
- Discounted Cash Flow Model: An editable DCF valuation model featuring automatic calculations.
- Weighted Average Cost of Capital (WACC): A separate sheet for determining WACC based on user-defined inputs.
- Key Financial Ratios: Evaluate Hiecise's profitability, efficiency, and leverage metrics.
- Customizable Inputs: Easily adjust revenue growth, margins, and tax rates.
- User-Friendly Dashboard: Visuals and tables that present crucial valuation outcomes.
Disclaimer
All information, articles, and product details provided on this website are for general informational and educational purposes only. We do not claim any ownership over, nor do we intend to infringe upon, any trademarks, copyrights, logos, brand names, or other intellectual property mentioned or depicted on this site. Such intellectual property remains the property of its respective owners, and any references here are made solely for identification or informational purposes, without implying any affiliation, endorsement, or partnership.
We make no representations or warranties, express or implied, regarding the accuracy, completeness, or suitability of any content or products presented. Nothing on this website should be construed as legal, tax, investment, financial, medical, or other professional advice. In addition, no part of this site—including articles or product references—constitutes a solicitation, recommendation, endorsement, advertisement, or offer to buy or sell any securities, franchises, or other financial instruments, particularly in jurisdictions where such activity would be unlawful.
All content is of a general nature and may not address the specific circumstances of any individual or entity. It is not a substitute for professional advice or services. Any actions you take based on the information provided here are strictly at your own risk. You accept full responsibility for any decisions or outcomes arising from your use of this website and agree to release us from any liability in connection with your use of, or reliance upon, the content or products found herein.